

Position Size Calculator: How Account Risk and Stop Distance Determine Trade Size
 zhan chen
Calculate position size from account equity, risk percentage and effective stop-loss cost. Includes worked stock, forex and futures examples, slippage, pip and tick values, correlation risk and a pre-trade verification checklist.
Core answer: position size is not chosen from conviction, leverage availability or a preferred lot size. It is calculated from the amount the account can lose if the trade is wrong, divided by the loss per unit between entry and the protective stop. The practical formula is:
Position size = account equity × risk percentage ÷ effective loss per unit
The word effective matters. A usable calculation includes the stop distance, contract multiplier, pip or tick value, currency conversion, expected slippage and transaction costs. Ignoring any of these can make the actual loss materially larger than the planned loss.
Start with money at risk, not market exposure
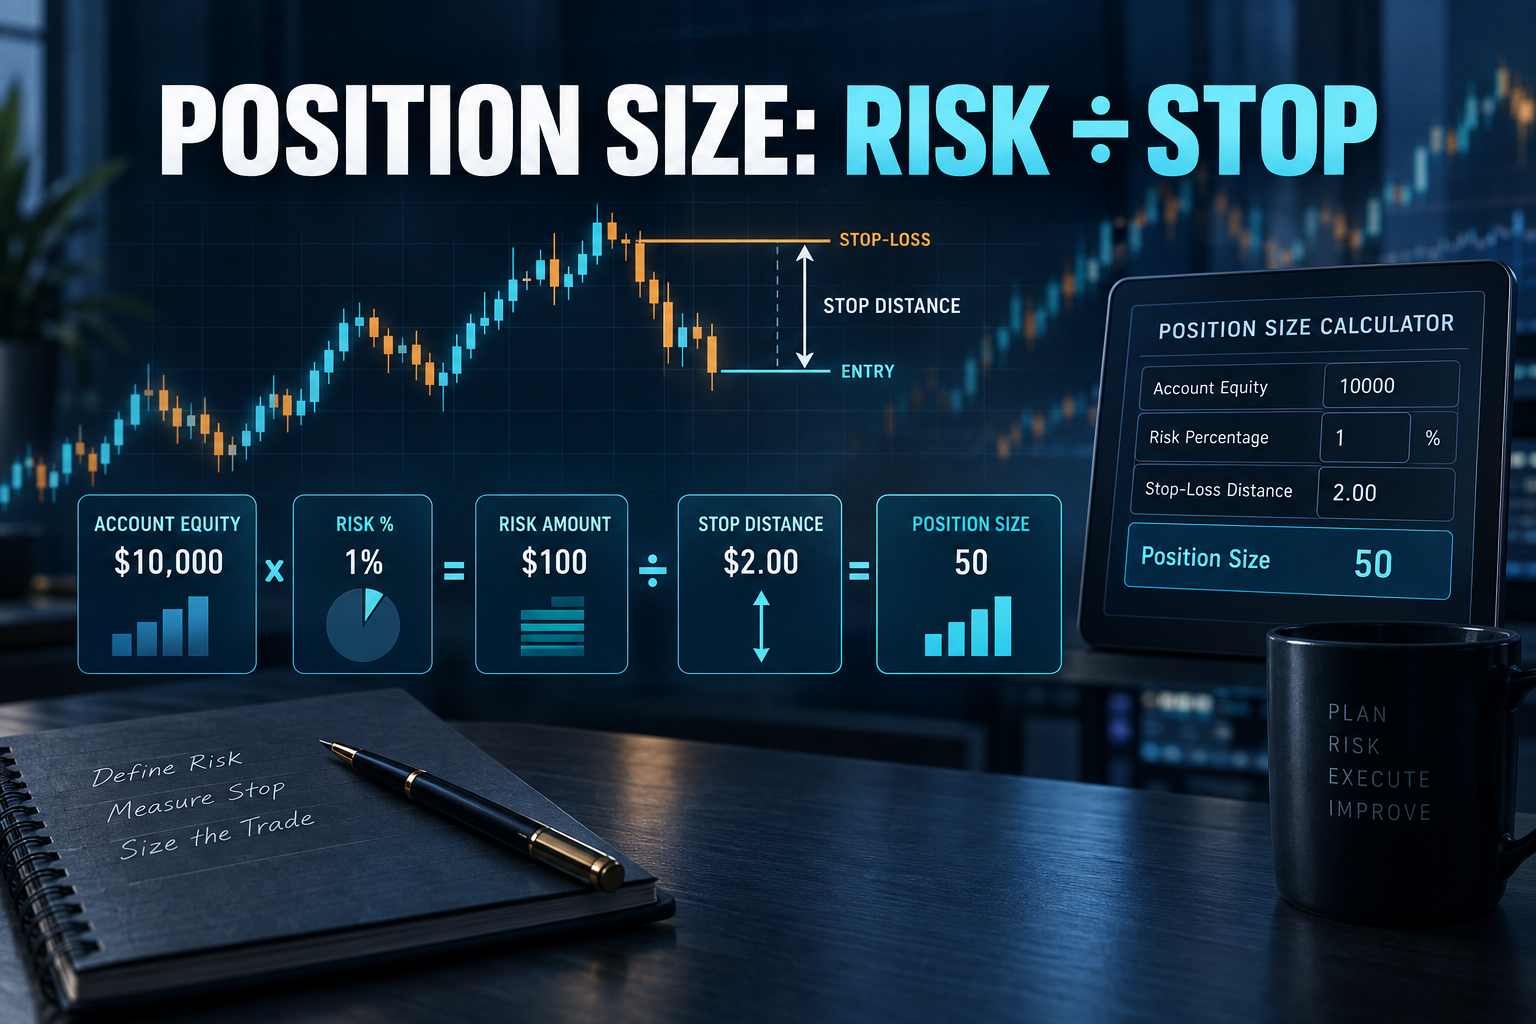
Suppose an account has equity of $10,000 and the trader caps the loss on one idea at 1%. The risk budget is therefore $100. This does not mean buying $100 of an asset, nor does it mean using 1% margin. It means that if the stop is filled at the assumed execution price, the combined trading loss and costs should be close to $100.
Now assume a stock entry at $50 and a technically justified stop at $48. The raw stop distance is $2 per share. Before costs and slippage, the maximum size is:
$100 ÷ $2 = 50 shares
The market exposure is $2,500, but the planned price risk is $100. Those are different quantities. Confusing exposure, margin and loss-at-stop is one of the most common position-sizing errors.
A four-step calculation that works across markets
1. Define account equity consistently
Use current net liquidation value, not the original deposit and not yesterday's rounded balance. Open-position profit and loss can change the amount genuinely available to absorb risk. If several positions share the same catalyst or currency exposure, reserve capacity for their combined risk rather than treating each order in isolation.
2. Set the risk budget
If equity is E and the chosen risk fraction is r, the nominal risk budget is E × r. A $25,000 account risking 0.60% has a $150 budget. The percentage is a ceiling, not a target that must be spent on every setup. When liquidity is poor or event risk is unusually high, the correct size may be smaller or zero.
3. Convert the stop into money per unit
For a cash equity, loss per unit is usually the entry-to-stop distance plus expected costs. For futures it is the distance in ticks multiplied by tick value. For foreign exchange it is the stop in pips multiplied by the pip value for the chosen lot size, converted into the account currency when necessary.
Effective loss per unit = stop distance × unit value + commissions + expected slippage
4. Round down to a tradable quantity
Divide the risk budget by effective loss per unit, then round down to the permitted share, contract or lot increment. Rounding up breaks the risk ceiling. After rounding, recalculate the full loss-at-stop to confirm the final order still fits.
Worked example: why costs change the answer
Consider a $30,000 account with a 0.75% risk cap. The risk budget is $225. A stock is bought at $84.40 with a stop at $81.90, producing a raw distance of $2.50. Assume an additional $0.10 per share for slippage and fees.
Effective loss per share is $2.60, so the calculated quantity is:
$225 ÷ $2.60 = 86.53 shares
Rounding down gives 86 shares. The planned loss is 86 × $2.60 = $223.60. Buying 90 shares because it looks cleaner would raise planned loss to $234, already above the stated limit.
This example also shows why moving a stop after choosing the size is dangerous. If the stop is widened from $81.90 to $80.90 without reducing the position, effective risk rises from $2.60 to $3.60 per share and planned loss jumps to $309.60. The trade thesis may be unchanged, but the account-level decision has changed materially.
Forex example: pip value and account currency
Assume a USD account permits a $120 loss on EUR/USD and the stop is 40 pips away. One standard lot of EUR/USD has a pip value of roughly $10 when USD is the quote currency. Risk per standard lot is therefore about $400 before costs. The raw size is $120 ÷ $400 = 0.30 standard lots.
If the pair does not have the account currency as its quote currency, pip value must be converted at the relevant exchange rate. The correct value also changes with position size and, for some crosses, with the conversion pair. A platform's displayed pip calculator is useful, but the trader should still verify the contract specification and account-currency conversion.
Futures example: tick size is not tick value
Suppose a futures contract has a minimum price fluctuation of 0.25 index points and each tick is worth $12.50. A stop 8 points away equals 32 ticks, so one contract carries $400 of price risk before fees and slippage. An account with a $900 risk budget can hold two contracts, not three: two contracts risk $800, while three risk $1,200.
The contract multiplier and tick value are product specifications. Never transfer values from a related micro, mini or standard contract merely because their charts look identical.
Where the simple formula can fail
Stops do not guarantee the exit price
A stop order becomes executable when triggered, but a market gap or thin order book can produce a fill beyond the planned level. Earnings, central-bank decisions, geopolitical shocks and weekend gaps are obvious examples. Position size should therefore include a realistic slippage allowance, and event risk may justify a stricter risk cap.
Correlated positions can be one hidden trade
Long positions in a stock index, a semiconductor stock and a high-beta currency may all depend on the same risk-on factor. Each order can satisfy its individual limit while the portfolio carries too much exposure to one scenario. Add the loss-at-stop for positions that are likely to fail together, then compare the total with a portfolio risk ceiling.
Volatility changes faster than account rules
A fixed 20-pip or $1 stop can become noise when volatility expands. The stop should first be placed at the level that invalidates the trade idea; position size is then adjusted to fit the risk budget. Choosing a large position first and squeezing the stop closer reverses the correct sequence and can turn ordinary price noise into repeated losses.
Leverage is a constraint, not the sizing method
Margin determines whether the account can open and maintain a position. It does not define how much the account should risk. A highly leveraged instrument can require little initial margin while still creating a large loss if price reaches the stop—or gaps through it.
Structural stops and volatility stops answer different questions
A structural stop sits beyond a price level that invalidates the thesis: a failed breakout, a broken swing low, a rejected value area or another market-defined boundary. A volatility stop uses a measure such as average true range to allow for ordinary movement. Neither method should be applied mechanically.
Assume a stock trades at $72. A structural invalidation level is $68.80, while a two-ATR stop would be $69.40. The tighter volatility stop allows a larger position, but it also exits before the structural thesis is disproved. The analyst must decide which question the stop is meant to answer before calculating size. The arithmetic cannot repair a logically misplaced stop.
- Structural stop distance: $3.20; quantity under a $240 budget before costs: 75 shares.
- Volatility stop distance: $2.60; quantity before costs: 92 shares.
- With $0.12 expected slippage per share, the adjusted quantities fall to 72 and 88 respectively.
The choice is not which position is larger. It is which stop correctly represents the trade's failure condition.
Stress-test the gap, not only the stop
The basic calculation assumes an exit near the stop. A second calculation should estimate a plausible adverse gap. If a stock position contains 86 shares and the planned loss per share is $2.60, nominal risk is $223.60. If an earnings gap could produce a $5.50 loss per share, stressed risk is $473—more than twice the plan.
Nominal risk = quantity × effective loss to the stop
Stressed risk = quantity × plausible gap loss per unit
A position can satisfy the nominal limit and still fail the stressed-risk limit. The response may be to reduce size, hedge a defined portion, wait until after the event or reject the trade. A stop order does not remove discontinuous-price risk.
Portfolio heat: five 1% trades can be one 5% bet
Portfolio heat is the sum of planned losses if all active stops are reached. Simple addition can still understate risk when several trades share the same driver and gap together.
Consider four positions with planned risks of $100, $120, $90 and $110. Total nominal heat is $420. On a $20,000 account, that equals 2.1% of equity. If the first three positions are all long risk assets and respond to the same rate shock, their combined $310 should be treated as a factor cluster, not three independent ideas.
- Per-trade ceiling: the most one position may lose.
- Factor-cluster ceiling: the most positions driven by the same catalyst may lose together.
- Total heat ceiling: the maximum planned loss across all open positions.
If a new order breaches any ceiling, reduce the new size, cut an existing correlated position or decline the trade.
How drawdowns change the next position automatically
Percentage-of-equity sizing reduces money at risk after losses. A $20,000 account risking 1% allows $200. After a 10% drawdown, equity is $18,000 and the next 1% risk budget becomes $180. This automatic contraction slows absolute losses without changing the strategy.
A pre-defined drawdown schedule can be stricter: up to 5% drawdown may allow 1.00% per trade; 5%–10% may allow 0.75%; beyond 10% may allow 0.50% until a defined recovery threshold is met. The thresholds are policy choices, but they must be written before the losing streak. Increasing risk to win it back can accelerate ruin.
Position size is limited by liquidity as well as risk
A formula can produce a quantity that is mathematically acceptable but operationally unrealistic. Compare the order with normal spread, displayed depth, average traded volume and volume available near the stop. If the order is large relative to routine liquidity, both entry and exit slippage assumptions must rise.
Calculate three cost cases: a base case using normal spread and execution; an adverse case using wider spread and partial depth; and an event case using a thin book or price gap. Size from the case relevant to the holding period and catalyst, not automatically from the cheapest recent fill.
A decision table for common sizing situations
| Situation | What changes | Correct response |
|---|---|---|
| Stop is widened before entry | Loss per unit rises | Reduce quantity and recalculate costs |
| Stop is tightened only to permit a larger trade | Failure level no longer matches the thesis | Reject the artificial stop |
| Spread or expected slippage rises | Effective loss per unit rises | Reduce quantity or wait for liquidity |
| A correlated position is already open | Factor-cluster risk rises | Use only the remaining cluster budget |
| Minimum contract is too large | Smallest tradable loss exceeds the budget | Use a smaller contract or skip the trade |
| Major event occurs during the holding period | Gap risk rises | Apply a stressed-loss limit |
Audit the sizing model with realized trades
For each closed trade, store planned entry, planned stop, planned quantity, expected cost, actual fills, maximum adverse excursion and realized loss. Then compare planned loss with realized loss.
Loss overrun = realized loss ÷ planned loss − 1
If a trade planned to lose $200 instead loses $250, the overrun is 25%. Persistent overruns point to optimistic slippage, stop changes, wrong pip conversion, an incorrect multiplier, partial fills or correlated gaps. The inputs must be repaired even when the formula is correct.
How to verify a position before sending the order
- Record current net account equity and the maximum risk percentage for the idea.
- Place the stop where the market would invalidate the thesis, not where a desired lot size makes the arithmetic convenient.
- Read the instrument's official contract specification: lot increment, multiplier, tick size, tick value and settlement currency.
- Convert stop distance into money per unit and add commissions, spread and a realistic slippage allowance.
- Divide the risk budget by effective loss per unit and round down.
- Recalculate loss-at-stop using the final quantity.
- Add correlated open positions and pending orders to test total portfolio risk.
- After execution, compare estimated and realized costs; update future assumptions if fills are consistently worse.
Decision rule
A valid position is one whose worst reasonable loss is acceptable before the order is placed. If the minimum tradable quantity exceeds the risk budget, the solution is not to move the stop closer without analytical justification. The solution is to use a smaller contract, choose another instrument or skip the trade.
Position sizing cannot improve a weak entry or make a negative-expectancy strategy profitable. Its role is narrower and essential: translate a market thesis into an account-level loss that is known, comparable and survivable.


