

Missing Forex Quotes: What Forward Filling Does to Volatility
 Eva Chen
Carrying an old forex quote into a data gap creates zero returns, not new market observations. Two reproducible price paths show why it can raise or lower measured volatility—and why a filled price cannot by itself support a backtest fill.
A flat stretch in a forex price file may describe an unchanged quote, or it may describe a feed that stopped recording. Those are different kinds of evidence. Copying the last available price into the empty rows makes the file look continuous, but does not establish what the market quoted during the gap.
Nor does filling gaps always make measured volatility smaller. It can hide a reversal, but it can also concentrate several gradual moves into one large recorded change. The practical question is whether the observations support the chosen sampling interval and execution assumptions—not whether a completed spreadsheet produces a reassuring number.
An unchanged quote and an unobserved quote are not the same thing
Suppose a EURUSD file is intended to contain a valid bid at every minute boundary. A collector failure leaves two boundaries missing. Forward filling assigns the last recorded bid to both. The resulting zeros in the return series are consequences of that assignment; they are not evidence that the bid stayed unchanged.
A different situation is a healthy event feed that reports changes to a standing quote. If its complete messages and quotation rules establish that the quote remained valid, carrying that state forward can be appropriate. A fresh record at the same price can also produce a genuine zero return. Do not delete every zero, or assume that an absence of new messages proves either inactivity or a fault.
Start by identifying what the source records: snapshots, changes, indicative prices, executable quotations or trades. Keep the instrument and the bid, ask or midpoint definition consistent. Before calling an interval missing, align its expected time boundaries; checking forex candle time windows and price definitions helps separate a window mismatch from a genuine recording gap.
The same surviving endpoints allow very different missing prices
Use hypothetical EURUSD bids, quoted in dollars per euro, on four consecutive minute boundaries on one UTC day. The only saved prices are 1.1000 at 12:00 and 1.1006 at 12:03. Records at 12:01 and 12:02 were lost. The table shows the filled series F and two possible complete minute-sampled paths, A and B, that agree with the saved endpoints.
| UTC time | Saved bid | Filled path F | Possible path A | Possible path B |
|---|---|---|---|---|
| 12:00 | 1.1000 | 1.1000 | 1.1000 | 1.1000 |
| 12:01 | Missing | 1.1000 | 1.1002 | 1.1010 |
| 12:02 | Missing | 1.1000 | 1.1004 | 1.0996 |
| 12:03 | 1.1006 | 1.1006 | 1.1006 | 1.1006 |
Path A rises by 2 pips in each minute. Path B moves by +10, −14 and +10 pips. F instead records 0, 0 and +6 pips. Here one EURUSD pip is 0.0001 dollar per euro. These changes are useful for reading the price movement, but pips are not the percentage-return basis points used in the volatility calculation below.
Neither A nor B is a recovered history, and neither is a continuous tick-by-tick path. They are deliberately constructed alternatives showing what the two saved prices cannot identify. The common endpoints establish the overall price change; they do not reveal the three individual one-minute changes.
A copied flat line can push the volatility calculation either way
For each one-minute interval define z_i = 10000 × ln(P_i/P_(i−1)), a log return measured in basis points. For this same three-minute window, calculate Q = Σz_i² and V = √Q. Q is the sampled realized-variance measure in squared basis points; V is its square root in basis points. Neither is annualized. This calculation does not subtract the mean or divide by the number of returns, so it is not the usual sample standard deviation.
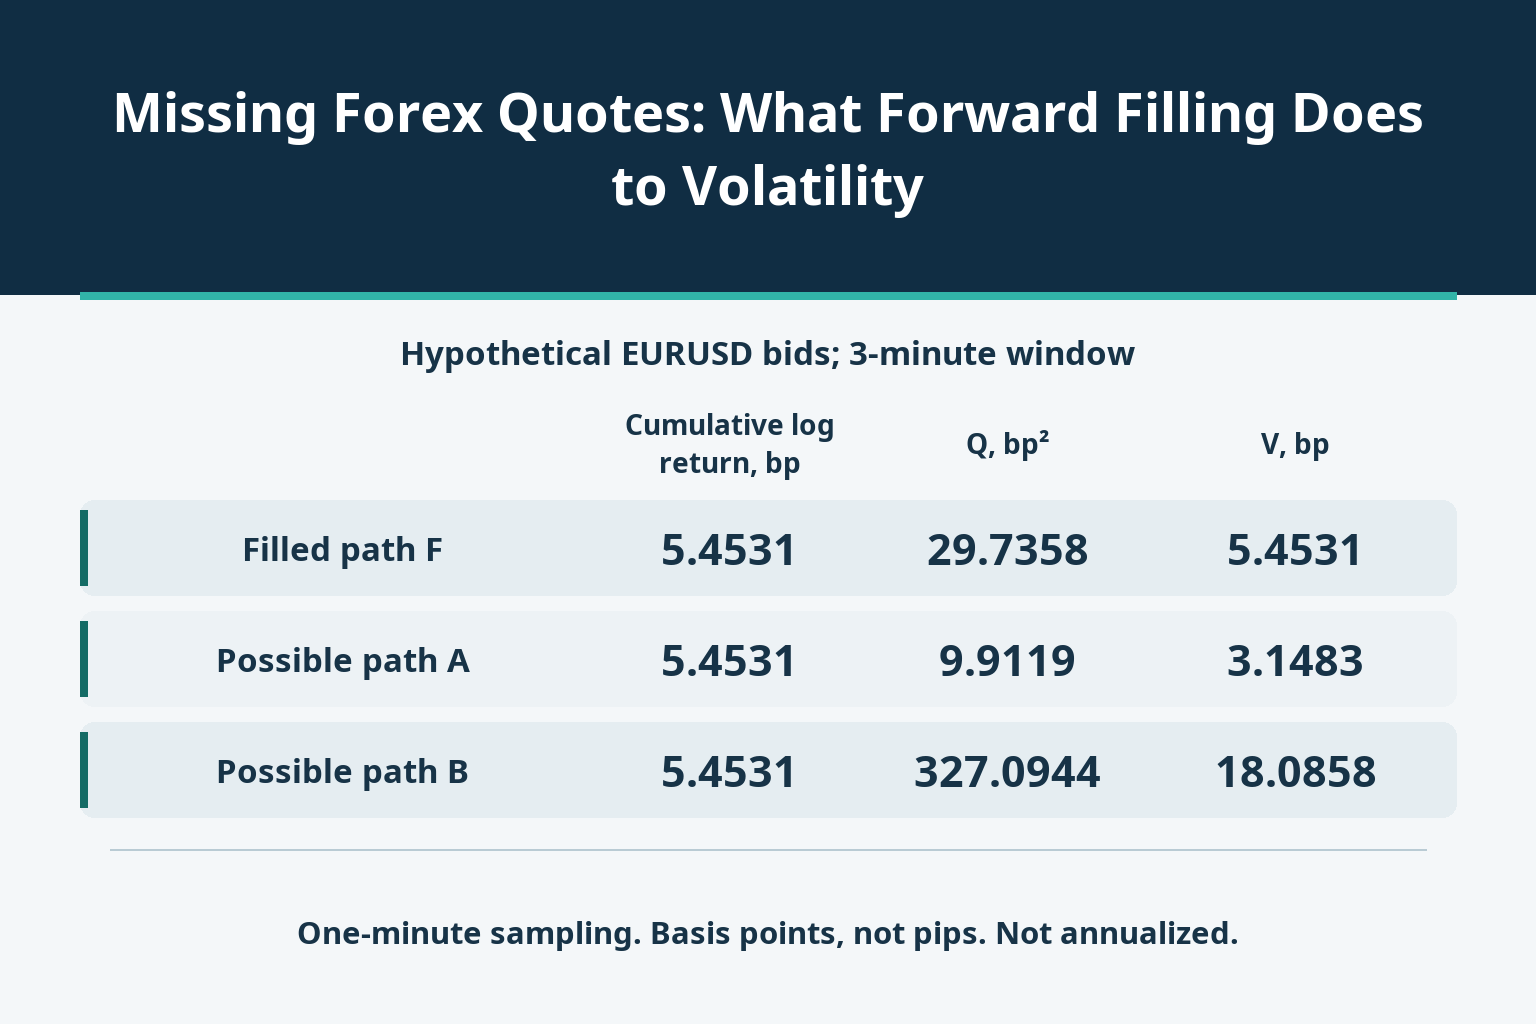
| Three-minute path | One-minute log returns, bp | Cumulative log return, bp | Q, bp² | V, bp |
|---|---|---|---|---|
| Filled F | 0; 0; 5.4531 | 5.4531 | 29.7358 | 5.4531 |
| Possible A | 1.8180; 1.8177; 1.8174 | 5.4531 | 9.9119 | 3.1483 |
| Possible B | 9.0868; −12.7238; 9.0901 | 5.4531 | 327.0944 | 18.0858 |
F produces Q = 29.7358, compared with 9.9119 for the gradual path A: filling has made the measured square sum roughly three times as large. Against the reversing path B, whose Q is 327.0944, the same filled series substantially understates it. Since the square root is increasing, the direction of the comparison is the same for V. There is no universal rule that the inserted zeros must lower the whole-window result.
The arithmetic explains why. When several missing log returns are replaced by zeros and one catch-up return, their squared contribution becomes (Σz_i)² rather than Σz_i². The difference is 2Σ_(i<j)z_i z_j. Moves in the same direction reinforce one another when combined; opposing moves can cancel. In all three examples, the cumulative log return remains 10000 × ln(1.1006/1.1000) = 5.4531 basis points.
These are comparisons on a specified one-minute grid over three minutes, not claims about the true continuous-time volatility or tomorrow’s risk. A and B are not confidence limits or the highest and lowest possible histories. More unobserved paths remain possible, and assigning equal probabilities to these two examples would add another unsupported assumption.
Do not turn the copied quote into an unsupported trade
The same gap can contaminate a trading test. Suppose the valid 12:00 quote is bid 1.1000 and ask 1.1002. A signal to buy 10000 euros arrives at 12:01 without using future information, but its execution quote is missing. The next saved valid quote, at 12:03, is bid 1.1006 and ask 1.1008. For this illustration there are no separate commissions, financing charges or slippage.
A test that simply treats the copied 1.1002 ask as an available entry at 12:01, then exits at the 12:03 bid, reports 10000 × (1.1006−1.1002) = $4 gross profit. The arithmetic is correct; the missing evidence is whether that entry was available at the signal time and for the required quantity. The filled row cannot supply it.
For contrast, explicitly change the model: the signal remains valid until the next saved quote, entry occurs at the 12:03 ask of 1.1008, and the position is immediately closed at the bid of 1.1006. That model produces a $2 gross loss. This is an intentionally different execution rule, not a reconstruction of the actual trade or a lower bound on its result. Both calculations already include the bid/ask difference; subtracting an estimated spread again would double-count it.
A stale timestamp alone does not prove that the old quote had expired, just as copying it does not prove it remained executable. Without a valid execution record or a predefined alternative execution rule, the trade remains unresolved—not a zero-profit observation. Cancelling or delaying a signal also changes the strategy; if it affects later positions, cash or entries, replay those consequences rather than choosing the favorable treatment afterward.
Removing the empty rows does not repair the missing minutes
If the two empty rows are deleted, the return from 12:00 to 12:03 is still a three-minute return. It can be correctly reported with that duration, but must not be relabelled as a one-minute observation and mixed into an equal-frequency calculation. Under a strict rule requiring genuine endpoint observations exactly one minute apart, none of the three one-minute returns in this example is available. The answer is missing information, not zero.
Four populated price rows also do not mean four independent observations. Two rows here contain copied values. Conversely, counting only nonzero returns is not a valid count of independent evidence: genuine quotes can repeat and successive returns can be dependent. Report original records, inserted values, gap lengths and coverage separately from statistical sample-size claims.
Filling backward from the next observation, or drawing an interpolated path using that future endpoint, can place information into a historical signal before it was available. Such a curve may be acceptable as a labelled retrospective illustration, but not as an unnoticed live-trading input. Carrying only past information avoids that particular timing error; it still does not make the old price current or executable.
Nor is deleting every incomplete period a neutral cure. If recording failures cluster in difficult market conditions, a complete-record subset can answer a different question from the intended full-period test. Keep the excluded coverage visible and examine how sensitive the conclusion is to the affected periods instead of silently discarding them.
Judge the history by its evidence, not its row count
Preserve the raw file. For every sampled value, retain the grid time, original quote time, source identifier, price side and a flag identifying inserted values; keep receipt time when available. The age of the last genuine quote must remain visible. Replacing its timestamp with the new row’s time disguises an old observation as a fresh one.
Check whether the feed was healthy, whether messages arrived out of order or were duplicated, and whether quote withdrawals or status changes were captured. Treat a known non-trading window differently from a collector outage. Match observations within the same instrument and price definition; separately carrying forward an old bid and a newer ask does not automatically produce a coherent executable quote.
Set any permitted quote-age limit before evaluating performance and test its effect. A limit of one filled row is not necessarily a limit of one minute on an irregular grid, and no single age limit establishes validity for every source. Keep timing, data-quality and execution checks separate: passing one does not imply passing the others.
Finally, show which returns and trades rely on substitutions, compare defensible treatments on clearly labelled windows, and retain unresolved cases. If the claimed volatility level or strategy advantage changes materially with an unsupported gap treatment, the history has not established that conclusion. A smoother chart and more decimal places cannot replace the missing observations.


