

Why a Shrinking MACD Histogram Does Not Confirm a Trend Reversal
 zhan chen
A rising price can produce smaller positive MACD bars. A full 12, 26, 9 calculation separates zero crossings, divergence and structural confirmation.
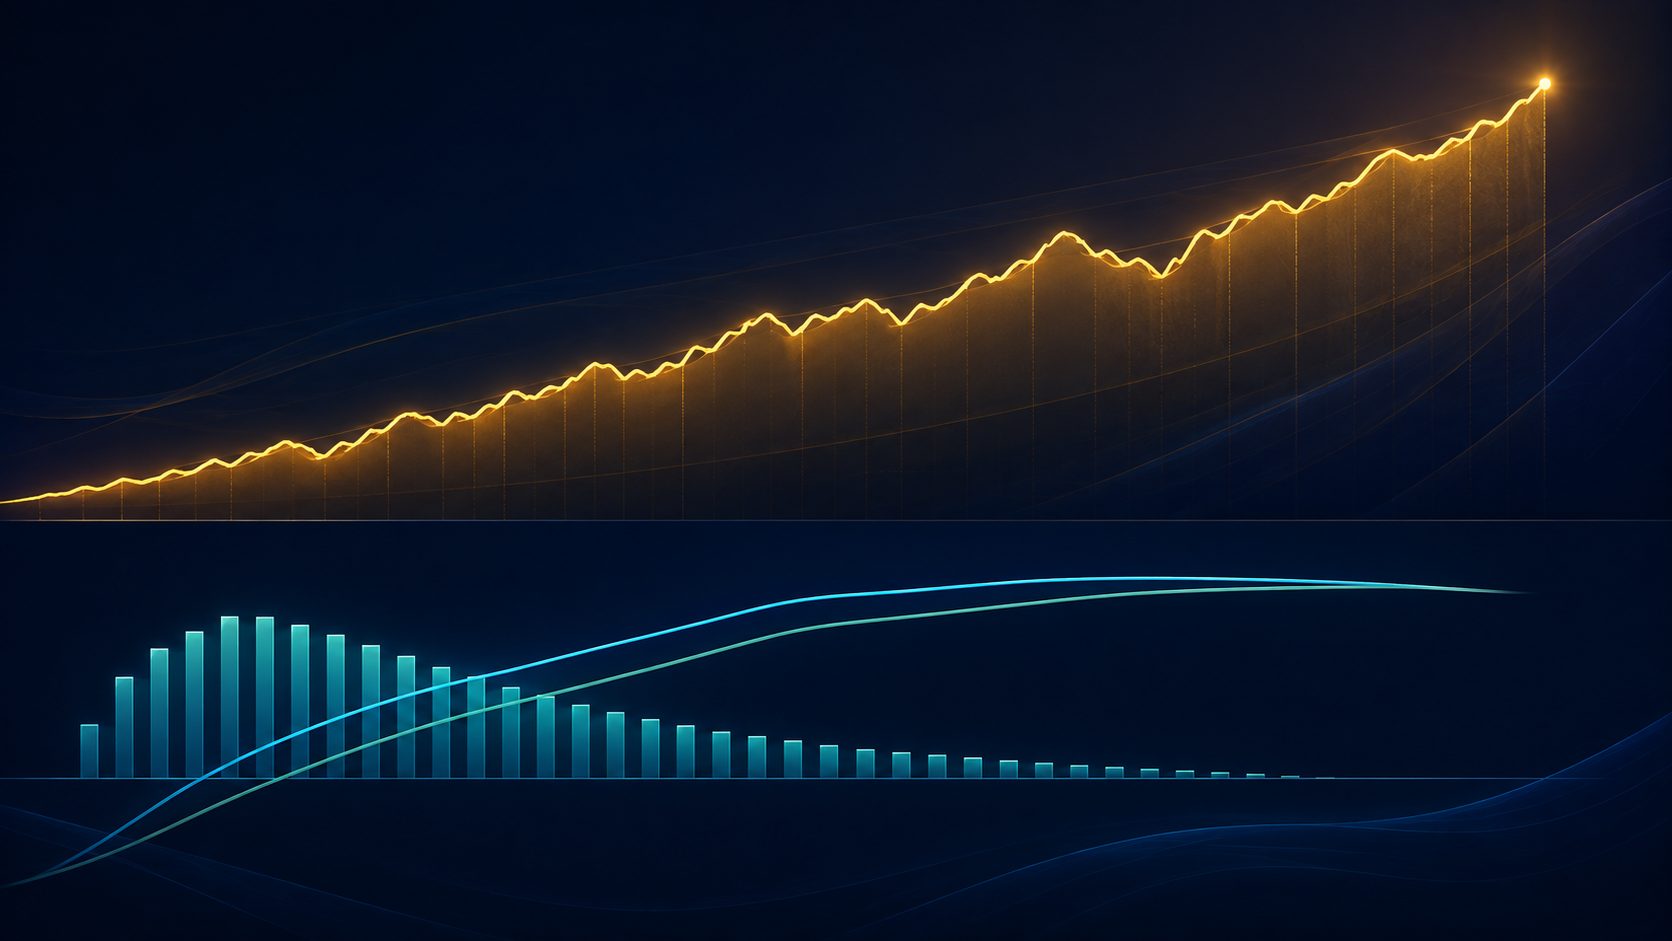
A shrinking MACD histogram establishes that the distance between two indicator lines is narrowing. It does not, by itself, establish a trend reversal. Price can keep making higher highs while the MACD line rises and positive bars shrink. Negative bars can approach zero while price continues to fall.
The distinction becomes clearer when three questions are kept separate: which side of zero the MACD line occupies, where it sits relative to its signal line, and whether price has broken its sequence of swing highs and lows.
Check what the histogram actually plots
This article uses explicit definitions: the MACD line, also labelled DIF, is the 12-period EMA minus the 26-period EMA. Its signal line, here labelled DEA, is a nine-period EMA of DIF. The histogram is DIF minus DEA. An EMA updates as previous EMA + 2 ÷ (periods + 1) × (current close − previous EMA).
DIF measures a difference between two smoothed prices; DEA smooths that difference; the histogram measures the remaining gap. It is not volume, net buying orders or the current price return. The guide to moving averages and crossovers explains the first layer of smoothing and its lag.
If a chart multiplies DIF minus DEA by two, bar height doubles but signs and zero-crossing times stay the same. A different signal-line calculation, or a display that plots DIF itself as bars, changes the interpretation more fundamentally. Colour conventions also differ: they may represent positive and negative values or growth and contraction from the previous bar. Inspect the settings before relying on red and green.
Two different questions about zero
| Observation | What follows from the definition | What does not follow |
|---|---|---|
| DIF above zero | The 12-period EMA exceeds the 26-period EMA | The next close must rise |
| Positive histogram | DIF exceeds DEA | DIF must itself be positive |
| Shrinking positive bars | The positive gap is narrowing | The uptrend has broken |
| Negative bars approaching zero | The negative gap is narrowing | Price has bottomed |
For example, DIF of −2 and DEA of −3 produce a positive histogram of +1 even though the shorter price average remains below the longer one. Conversely, DIF of +2 and DEA of +3 produce a negative bar of −1 while the shorter average remains above the longer one. A histogram zero crossing and a DIF zero crossing are different events.
A reproducible example: higher prices, smaller bars
Assume 40 preceding closes all equal 100, so both price EMAs equal 100 and DIF and DEA equal zero. The next five closes are 103, 106, 109, 112 and 115. Thereafter price rises by one point per period: 116, 117, 118, 119, 120, 121 and 122. Apply the 12, 26 and 9 settings without rounding intermediate values.
On the first rising period, the fast EMA is 100 + 2/13 × 3, approximately 100.4615. The slow EMA is 100 + 2/27 × 3, approximately 100.2222. DIF is about 0.2393, DEA is 0.2 × DIF, about 0.0479, and the histogram is about 0.1915. Repeating that calculation gives:
| Period after rise begins | Close | DIF | DEA | Histogram |
|---|---|---|---|---|
| 7 | 117 | 3.8011 | 1.9705 | 1.8306 |
| 8 | 118 | 4.2575 | 2.4279 | 1.8296 |
| 9 | 119 | 4.6464 | 2.8716 | 1.7748 |
| 10 | 120 | 4.9779 | 3.2929 | 1.6850 |
| 11 | 121 | 5.2607 | 3.6864 | 1.5742 |
| 12 | 122 | 5.5020 | 4.0495 | 1.4525 |
Price rises from 117 to 122 and DIF keeps climbing, yet the histogram contracts from 1.8306 to 1.4525. After price switches from three-point gains to one-point gains, DEA gradually catches up with DIF. No price decline is required.
Calling the histogram a direct measure of price acceleration is therefore too literal. Each close in the table increases by the same point, but the bars still change because the indicator retains a smoothed history. Subtracting the rounded table entries can differ from the displayed histogram by 0.0001; the underlying calculation uses full precision.
For the bearish mirror image, replace every close with 200 minus that close. The starting level remains 100, while DIF, DEA and the histogram change signs. Price keeps falling as negative bars converge towards zero. Shrinking negative bars alone cannot establish a bottom.
Let price structure test the reversal hypothesis
Smaller positive bars can prompt a review of momentum, but the last meaningful pullback low provides different evidence. Suppose price rises from 100 to 110, retreats to 106, then reaches 114. A smaller second histogram peak is a divergence candidate. If 106 holds and subsequent lows keep rising, contraction alone has not broken the uptrend.
A later break below 106, followed by a rebound that cannot regain the former support and forms a high below 114, supplies a more complete weakening structure. These are invented levels. A brief dip can also reverse, so define an effective break consistently—by a close, a retest or another predetermined rule.
Structural confirmation usually comes later than the first shrinking bar. Waiting gives up part of the move; acting earlier accepts more risk that the trend will continue. MACD cannot remove that trade-off. Existing holders can use a momentum warning to review protection or additional exposure without treating it as an automatic instruction to reverse positions.
Why divergence can repeat without a reversal
A higher price high with a lower indicator high is a familiar bearish divergence description. First decide whether the comparison uses DIF peaks or histogram peaks, and keep that choice consistent. Compare swings of similar scale rather than pairing a complete leg with an isolated gap.
A strong trend can shift from rapid gains to gentler gains and generate repeated smaller histogram peaks. The smoothed momentum pattern has changed; supply and demand need not have changed enough to reverse price. Repeatedly adding against the trend because divergence persists exposes the position to further extension.
If price breaks the previous high again while maintaining higher lows, reassess a reversal thesis built on divergence. Conversely, if price has already broken an important structure, a still-positive histogram caused by smoothing should not be used to dismiss that evidence.
Market data conventions affect the reading
In FX and spot gold, quote sources, daily session boundaries and missing-data treatment can cause differences. The 12, 26 and 9 settings count bars: a four-hour chart and a daily chart cover different spans of calendar time. A forming bar changes with the latest price, so intrabar contraction may disappear by the close.
For equities, splits, dividends and price-adjustment choices change the historical series. An untreated discontinuity may produce a large bar without a comparable shift in trading momentum. Continuous futures can also contain roll gaps. If an indicator change coincides with a contract switch, compare it with the individual delivery contract.
MACD itself contains neither volume nor open interest, so conclusions about capital flows require other evidence. Raw histogram heights are also unsuitable for ranking instruments: the same percentage change in a high-priced metal and a currency pair near one produces different absolute price differences. MACD has no fixed 0–100 range like RSI.
Available history matters too. A short loaded series and a longer series cropped to the same date can differ because of EMA initialisation. Check warm-up data, particularly for newly listed instruments or a changed feed.
Range-bound signals still have to cover costs
When price oscillates around similar levels, the averages converge and DIF and DEA can cross repeatedly. Contraction, zero crossings and expansion may follow one another without a move large enough to cover spreads and fees. Shorter settings react faster but can increase this back-and-forth; longer settings add lag.
Evaluate a use case with fixed data, settings, close confirmation and invalidation rules, including fees and plausible slippage. One successful reversal says little about the cost of trend extensions and trading ranges. The histogram supplies a calculable change in a gap. Price structure, timeframe and execution costs determine what that change can support.


