

Maximum Forex Drawdown in Dollars vs Percent: Why the Worst Episodes Can Differ
 Patrick Turner
A $1,500 forex drawdown can be only 7.5%, while the largest percentage drawdown is 10% and just $1,200. Rebuild each earlier peak, later trough and open-position mark before pairing the numbers in a risk report.
The largest dollar drawdown and the largest percentage drawdown need not describe the same decline in a forex account. A larger account peak can lose more dollars while giving up a smaller fraction of capital. Read the label and the matching peak-to-trough episode before treating two maximum figures as one pair.
The hypothetical USD account below finishes at $21,000 from $10,000. Its closing observations show a maximum monetary drawdown of $1,500, accompanied by 7.5%. Its maximum relative drawdown is instead 10%, accompanied by $1,200. Both are correct. A separate intratrade EUR/USD valuation also shows why the closed-balance curve alone cannot certify the worst equity drawdown.
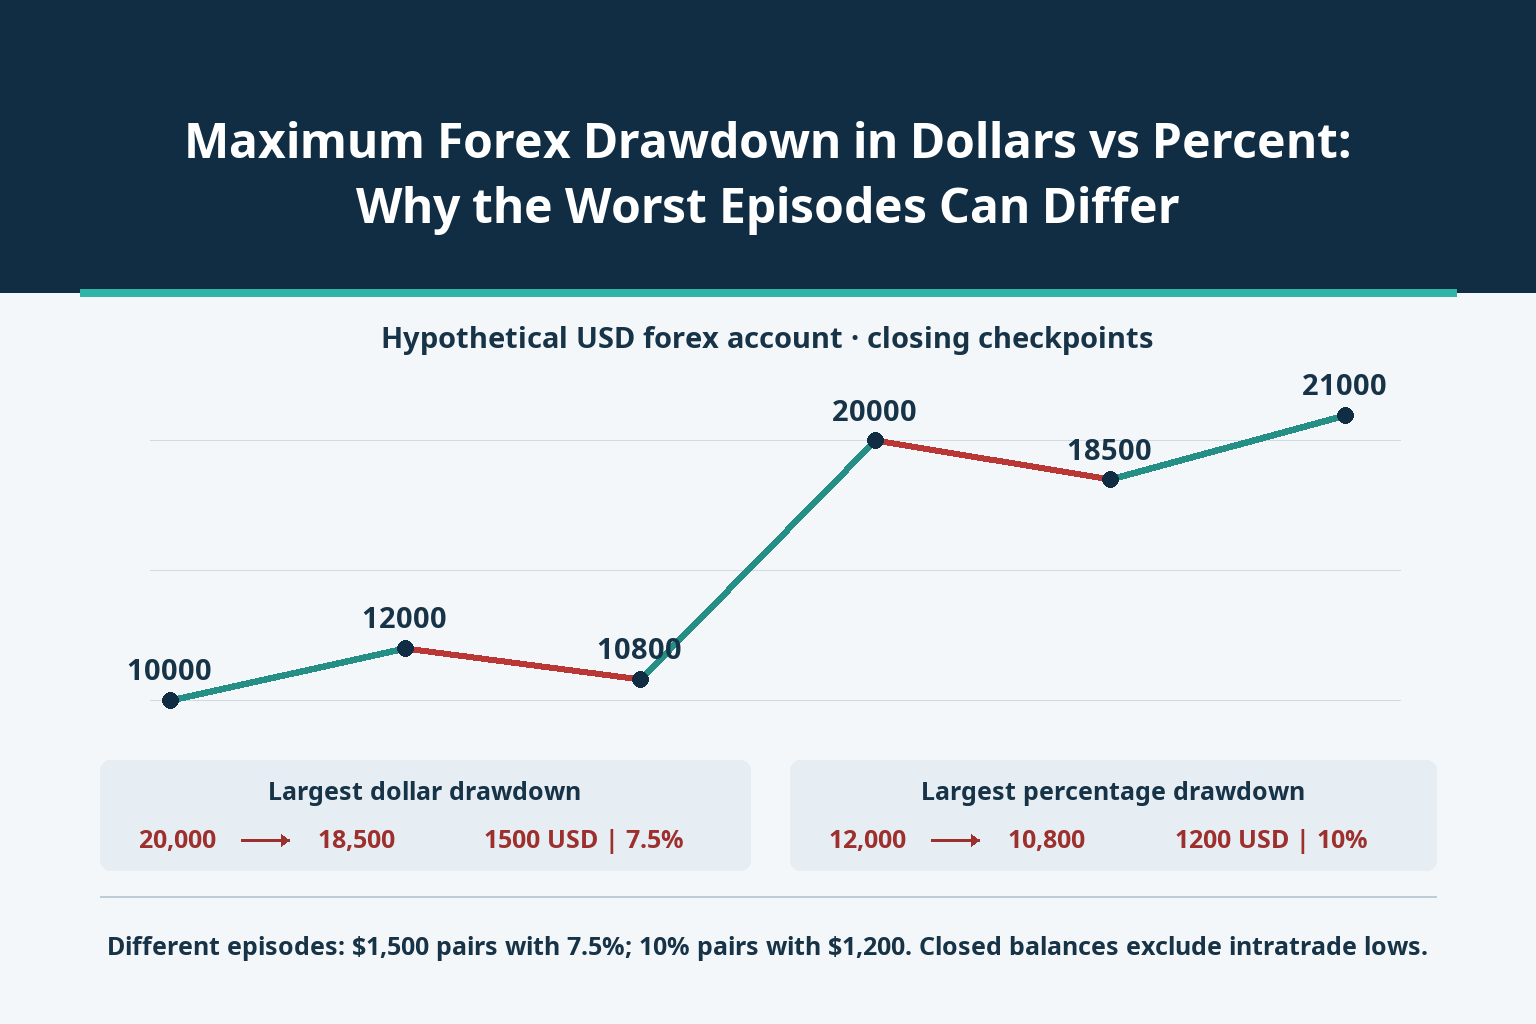
Define the running peak before comparing the two maximums
For each positive account value V, retain the highest value H observed no later than that point. The monetary drawdown is H−V. Its relative magnitude is (H−V)/H×100%. Find the maximum of each series separately. The percentage denominator is that earlier peak, not initial capital, the current balance, margin used or the largest peak reached later.
A report may display the largest monetary drawdown with the percentage recorded during that same decline. Another field may display the largest percentage with its corresponding dollar amount. The accompanying figures are not necessarily the other series’ maximums. Ask for the peak and trough timestamps if a label such as maximum drawdown is ambiguous.
Fix the measurement boundary too: balance or marked equity, account currency, period, sampling frequency and costs. Here all figures are USD, there are no external cash flows, credits, other positions or conversion effects, and supplied closed results are already net of their applicable recorded costs. At each closing checkpoint the account is flat, so balance equals equity.
Reproduce the closed-account path one observation at a time
Start at $10,000 and apply five hypothetical closed net results in order: +$2,000, −$1,200, +$9,200, −$1,500 and +$2,500. They are fixed recorded dollar results, not percentage returns or a position-sizing rule. The following table includes the starting observation and updates the running peak only when a new high is reached.
| Checkpoint | Balance USD | Earlier running peak USD | Drawdown USD | Drawdown % |
|---|---|---|---|---|
| Start | 10,000 | 10,000 | 0 | 0 |
| After +2,000 | 12,000 | 12,000 | 0 | 0 |
| After −1,200 | 10,800 | 12,000 | 1,200 | 10 |
| After +9,200 | 20,000 | 20,000 | 0 | 0 |
| After −1,500 | 18,500 | 20,000 | 1,500 | 7.5 |
| After +2,500 | 21,000 | 21,000 | 0 | 0 |
The account never falls below its initial $10,000 at these closing checkpoints. An initial-capital shortfall measured on this particular series is therefore zero, yet peak-to-trough drawdowns are positive. Ending profit, loss below the initial deposit and loss from an intervening peak are three different measurements.
The $21,000 finish is an $11,000 net gain, or 110% of the starting amount under the no-flow assumption. It does not erase the earlier drawdowns. Nor do these closing balances reveal prices and equity between observations; missing intratrade values are not zero losses.
Keep each maximum attached to its own peak and trough
The first decline is $12,000 to $10,800: $1,200, or 1,200/12,000 = 10%. The later decline is $20,000 to $18,500: $1,500, or 1,500/20,000 = 7.5%. The second is worse in dollars; the first is worse as a percentage. Reporting $1,500 and 10% as if they arose together invents a pairing that is absent from the record.
Dividing the largest $1,500 decline by the original $10,000 gives 15%. That is a deliberately different normalisation, not the maximum relative drawdown defined against the preceding peak. Dividing by the final $21,000 is different again. An alternative denominator can be useful if clearly named, but cannot silently replace the report’s definition.
Recovery also uses the relevant trough. Recovering from $10,800 to $12,000 requires 12,000/10,800−1 = 11.1111%, approximately. Recovering from $18,500 to $20,000 requires about 8.1081%. The required gain is not simply the preceding 10% or 7.5% loss repeated with a positive sign.
These episode comparisons assume usable positive values. Equity at or below zero, a changed reporting currency or an externally funded new high needs separate treatment. For cash transfers, use the worked guide to removing deposits and withdrawals from a drawdown chart; the present calculation deliberately contains none.
The same closed profits can produce a different drawdown in a different order
As a diagnostic exercise, reorder the same five fixed results to −$1,200, −$1,500, +$2,000, +$9,200 and +$2,500. The balances become $10,000, $8,800, $7,300, $9,300, $18,500 and $21,000. The running peak remains $10,000 during the first losses, so the maximum observed closing drawdown is $2,700, or 27%.
Ending profit is still $11,000 and three of five results are positive: a 60% win rate. Positive results total $13,700; loss magnitudes total $2,700. Their ratio is approximately 5.0741 in either order. None of those distribution summaries determines when the losses accumulate relative to a previous high.
| Observed series | Maximum money and its % | Maximum % and its money | Ending USD |
|---|---|---|---|
| Original closing order | 1,500 USD; 7.5% | 10%; 1,200 USD | 21,000 |
| Permuted fixed closed results | 2,700 USD; 27% | 27%; 2,700 USD | 21,000 |
| Original order plus stated open mark | 3,000 USD; 25% | 25%; 3,000 USD | 21,000 |
This permutation is bookkeeping analysis, not a replayable trading strategy or a probability model. Reordering actual forex trades can change executable prices, position sizes, funding, margin availability and later signals. A percentage-of-equity sizing rule would also change dollar outcomes after losses. Keep the fixed-result assumption visible rather than presenting the second path as an equally achievable market history.
Add an open-position mark before trusting a balance-only result
Return to the original order. Before the third trade closes, balance is $10,800. Add a separate explicit intratrade illustration: a 100,000-EUR long EUR/USD entry at 1.1000 is marked at an executable bid of 1.0820. Its price loss is 100,000×(1.0820−1.1000) = −$1,800. With no additional charges on this illustrative trade and no other exposure, observed equity is $9,000.
The earlier observed equity peak is $12,000. Its decline to $9,000 is therefore $3,000, or 25%, although closed balance remains $10,800. A later hypothetical actual closing bid of 1.1920 produces $9,200 price profit, matching the third closed result. That later close does not remove the intervening risk.
The 25% is the maximum on the supplied expanded observation grid, and at least that much drawdown has been demonstrated. It is not proof that no deeper low occurred between marks. Denser observations of the same consistently valued series can reveal additional extremes; stale prices or a changed valuation method are different data, not just higher frequency.
Margin requirements or stop-out could prevent the assumed recovery from ever taking place. Do not infer that $10,000 is sufficient funding for 100,000 EUR or that a 25% review threshold guarantees an exit there. Drawdown describes a path; collateral availability, spread, execution and future gaps require their own checks.
Audit the field rather than accepting a single headline percentage
Request the actual account-value series, not just closed winners and losers. Record timestamps, currency, balances, open quantities, valuation bid or ask, posted and accrued costs, and any transfers. Confirm which fills belong to the account and avoid counting a commission once in net trade results and again as a separate deduction.
Recalculate the running high in chronological order. Preserve the peak, trough, dollar decline and percentage for every candidate episode; keep separate records for maximum money and maximum percent. Check the original sequence before any permutation, and label closing-only or sampled results by their observation frequency.
Finally test the missing conditions: intratrade losses, altered sizing, cash flows and margin constraints. If the data stop before recovery, call the episode unrecovered rather than assuming the final date is a recovery. Historical maximums are observed measurements, not upper limits on the next forex loss. A useful report lets you reconstruct both the number and the path that produced it.


