

Forex Backtests: Which Wins When One Candle Hits Both Stop and Target?
 James Riley
A candle can cross both exits without revealing their order. Rebuild two identical-OHLC paths, measure the unresolved P/L range and identify the data needed before trusting a forex backtest.
If a forex candle contains both a stop-loss and a take-profit level, its high and low do not normally tell you which exit happened first. Assigning the profitable exit by default turns a missing observation into a trading advantage that the data have not established.
The useful question is not which assumption produces the smoother equity curve. It is how much of the reported result depends on an unresolved price sequence, and whether better evidence can resolve it. A controlled example separates that issue from spread, entry timing and execution risk.
Define the position before interpreting the candle
Consider a hypothetical USD account buying 10,000 EUR/USD units at an actual Ask fill of 1.1002, when Bid is 1.1000. A full-position stop at Bid 1.0990 and target at Bid 1.1020 become active after entry. There is no re-entry. Assume continuous movement, exact fills at the exit levels and a fixed 0.0002 spread solely for this illustration. These are modelling assumptions, not execution guarantees.
The initial price risk is 10,000×(1.1002−1.0990)=12 USD. The target pays 10,000×(1.1020−1.1002)=18 USD, or 1.5R. Measuring from the Bid open instead would incorrectly call these distances 10 and 20 USD while ignoring the actual entry fill. Do not subtract another estimated spread from the resulting fill-to-fill P/L.
Suppose the Bid candle has open 1.1000, high 1.1025, low 1.0985 and close 1.1010. Both exits lie inside its range. The close above the open tells us the candle is positive, not which extreme occurred first.
Build two paths with exactly the same OHLC
Imagine continuous movement between each of the following quoted points. Both paths reproduce the same four candle values, but the first active exit differs.
| Path after entry | First active exit | Gross USD | Same candle |
|---|---|---|---|
| Open → high → low → close | Target 1.1020 | +18 | Yes |
| Open → low → high → close | Stop 1.0990 | −12 | Yes |
| OHLC without sequence | Unresolved | −12 or +18 | Identical OHLC |
On the high-first path, Bid crosses the target before the later fall; the trade ends at a gross gain of 18 USD. On the low-first path, it crosses the stop first and ends at a loss of 12 USD. The subsequent rebound does not revive a fully closed trade. Recording both exits would require another position or an explicit partial-exit rule, neither of which exists in this example.
The difference is 30 USD for the same candle. Choosing an open-high-low-close path because the candle finished higher is an additional rule, not a conclusion contained in OHLC. An open-low-high-close convention is equally a model until the sequence is observed.
Measure how much uncertainty reaches the report
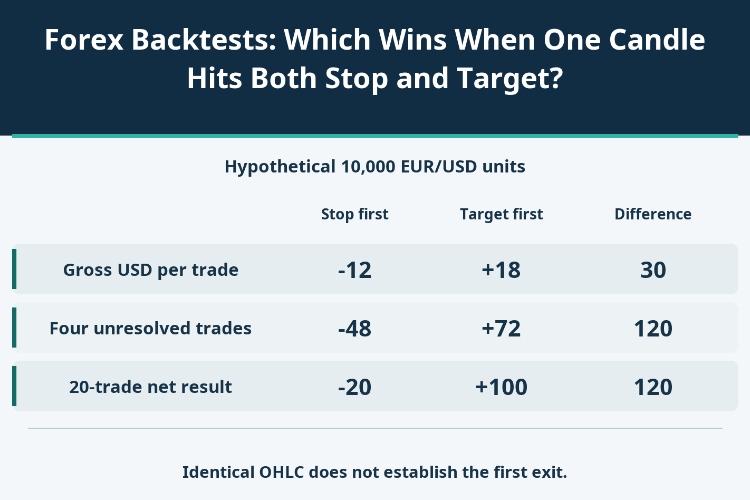
Take 20 hypothetical independent trades of the same size and fixed exit distances. Eight unambiguous trades hit the target and eight hit the stop; their combined gross result is 8×18−8×12=48 USD. Four more have the unresolved both-hit pattern. Keep the same entries and do not compound position size.
| Assignment of four unresolved trades | Known subtotal USD | Four trades USD | Total gross USD |
|---|---|---|---|
| All stop-first | +48 | −48 | 0 |
| All target-first | +48 | +72 | +120 |
| Unknown order | +48 | −48 to +72 | 0 to +120 |
Assigning all four unresolved trades to the stop gives zero gross profit across the 20. Assigning them to the target gives 120 USD. With an illustrative explicit commission of 1 USD per completed trade, the net range is −20 to +100 USD: mean −1 to +5 USD per trade, or −1/12 to 5/12 of the original 12 USD risk.
This interval is a scenario range under the fixed assumptions, not a confidence interval or a forecast. A 50/50 split is not justified merely because two paths can be drawn. Gaps, changed fills, path-dependent entries or sizing can move results outside this simplified range.
Smaller candles are evidence only if they resolve the order
A lower timeframe can show one exit in an earlier sub-bar than the other. That helps only after confirming the entry was already active and both price series use compatible timestamps and quote sides. If both levels still lie within one smaller bar, the same problem remains at finer resolution.
A generated tick path is not a recording of the missing sequence. More simulated points can make the graph look detailed without adding observed information. Distinguish archived quotes from reconstructed prices, and inspect coverage gaps instead of assuming a mode label proves every interval is observed.
For conventional bid/ask accounting, this long closes against Bid; a short normally closes against Ask. The contract and order-trigger rules control the actual test. A midpoint candle cannot automatically substitute for either side. Use the forex Bid/Ask stop-trigger check to separate the quote-side question from the first-hit sequence question.
Do not cure one bias by introducing another
If the entry signal uses the candle’s final close, entering at that same candle’s open uses information not yet available at entry. Fix the signal timestamp first. For a mid-bar entry, a high or low reached before entry is not evidence that an exit fired afterwards.
A stop-first convention is a useful conservative stress case for the fixed independent trades above, but it is not proof of what happened. When an exit determines a later re-entry, a trailing stop, margin availability or the next trade size, changing one result changes later states. Replay the full rule set rather than flipping isolated outcome labels.
Do not delete unresolved trades, quietly classify all of them as wins, or keep only those whose lower-timeframe data happened to be available. Record the unresolved share and the maximum difference it can make under the chosen model. Otherwise data availability itself can select the reported performance.
Turn the ambiguity into a reproducible acceptance test
For every both-hit trade, retain the instrument, feed, timezone, candle boundaries, Bid/Ask basis, signal time, actual entry assumption, exit activation time and fixed order levels. Save the coarse bar alongside any timestamped observations used to resolve it. The first eligible event must occur after the order is active.
Run the high-first and low-first toy paths through the same test logic. The expected gross outputs here are +18 and −12 USD, with one full exit each. Add tests for entry after an earlier extreme, a gap through the stop, missing quotes and a changed spread. A passing arithmetic test alone does not establish a realistic fill model.
Before treating the strategy result as decision-ready, rerun with consistent data and execution assumptions, retain unresolved cases explicitly and compare the effect with the total reported edge. If the sign of net expectancy changes within a plausible unresolved range, the evidence does not yet establish that edge. That is a data-quality conclusion, not a recommendation to choose the most flattering path.


