

Why a Dollar Basket Can Rise While USD/JPY Falls: Effective Exchange Rates Explained
 Eva Chen
A stronger currency index does not mean gains against every currency. Rebuild two hypothetical dollar baskets from the same three exchange rates, distinguish geometric weighting from a simple average, and see why a new index base changes the level without changing the return.
A dollar index can rise while USD/JPY falls. There is no contradiction: the index combines several bilateral exchange rates, whereas USD/JPY measures only the dollar against the yen. Whether the basket rises depends on which currencies it contains, how much weight each receives and how their changes are combined.
Before using an index to describe dollar strength, identify the exact series. Its basket, weighting period, quote direction and nominal or real definition matter. The examples below use invented rates and weights, not a published index or a live market move, so the calculation can be checked without mistaking an illustration for a current dollar signal.
An effective exchange rate answers a broader question than one currency pair
A bilateral rate compares two currencies. An effective exchange rate combines the home currency’s value against a specified group of other currencies. The Bank of England describes exchange rate indices as typically using weighted geometric averages; currency selection and weights depend on the purpose and trade relationships represented. Different baskets need not give identical answers.
A nominal effective exchange rate uses exchange rates. A real effective exchange rate also incorporates relative prices: the BIS adjusts its nominal indices using relative consumer prices. An increase in those BIS measures denotes appreciation, but a nominal move alone is not the same calculation as a real move. Check the series definition rather than treating the two labels as interchangeable.
The index is also not automatically the return on a funded portfolio. A statistical trade weight is not an instruction to allocate the same percentage of account cash to a currency trade. Executable bid–ask prices, financing, transaction costs and rebalancing would require a separate investment calculation.
Put every exchange rate in the same direction before calculating changes
For this dollar-strength model, let e mean units of foreign currency per one US dollar. A higher e means the dollar buys more of that foreign currency. Use matching start and end observations for all three currencies. The four-decimal rates below are hypothetical analytical inputs, not executable two-way quotes.
| Foreign currency per USD | Start rate | End rate | End/start ratio | USD change, % |
|---|---|---|---|---|
| EUR per USD | 0.9000 | 0.9450 | 1.05000 | +5.000 |
| JPY per USD | 150.0000 | 144.0000 | 0.96000 | −4.000 |
| GBP per USD | 0.8000 | 0.8240 | 1.03000 | +3.000 |
The dollar gains 5% against the euro and 3% against sterling, but loses 4% against the yen. The yen row is USD/JPY: 150.0000 to 144.0000. The euro and sterling rows are deliberately written as euros and pounds per dollar, even though readers often encounter the inverse market quotations EUR/USD and GBP/USD.
To obtain the euro row from EUR/USD, invert both observations before taking their ratio. Here the inverse quotes are 1/0.9000 and 1/0.9450 dollars per euro. Their end/start ratio is 1/1.05, approximately 0.952381, not 1.05. Mixing that inverse ratio with the correctly oriented yen and sterling ratios would change the question mid-calculation. See why inverse forex quotations have different percentage changes for the percentage-change distinction.
Do not average the raw exchange-rate levels. A yen quote around 150 and a euro quote around 0.9 have different units; their numerical size says nothing about their intended economic importance. The comparable inputs are dimensionless end/start ratios, with the weights defined separately.
Build the basket with a weighted product, not a simple average of returns
Let rᵢ = eᵢ,₁/eᵢ,₀ and let the non-negative weights wᵢ sum to 1. For one interval with fixed weights, the model is I₁ = I₀×∏rᵢ^wᵢ. The Federal Reserve’s published dollar-index methodology uses this geometric change structure with dollar prices expressed in foreign currency. Our three-currency example is a simplified illustration of the calculation, not a reconstruction of its official basket.
Set Basket A’s euro, yen and sterling weights to 0.50, 0.30 and 0.20. Its factor is 1.05^0.50×0.96^0.30×1.03^0.20 = 1.0182243166. Starting at 100, it ends at 101.8224317, a gain of 1.8224317%. The basket rises even though USD/JPY falls 4%. Gains in the other weighted components outweigh the yen component’s negative contribution.
A simple weighted average of the three percentage changes gives 0.50×5% + 0.30×(−4%) + 0.20×3% = 1.900%. That is a different calculation, not the exact geometric result. The difference of about 0.0775683 percentage points is not a fee or missing return. An arithmetic calculation can be a rough approximation for small changes, but cannot silently replace the stated index formula.
For an audit, work in logarithms: ln(I₁/I₀) = Σwᵢ ln(rᵢ). Basket A’s three terms are approximately 0.02439508, −0.01224660 and 0.00591176. Their sum is 0.01806024; exponentiating it gives the factor above. These are log contributions, not ordinary percentage-point returns. Multiplying the unrounded log sum by 100 gives about 1.8060244%, not the ordinary return of 1.8224317%; the latter is 100×(exp(log sum)−1).
The formula requires positive rates and complete components for the same interval. A missing or stale component is not automatically an unchanged currency. A reversal of quote direction, a different timestamp or a substitute weight can change the result even when the arithmetic itself is performed correctly.
The same rates can produce opposite index directions under different weights
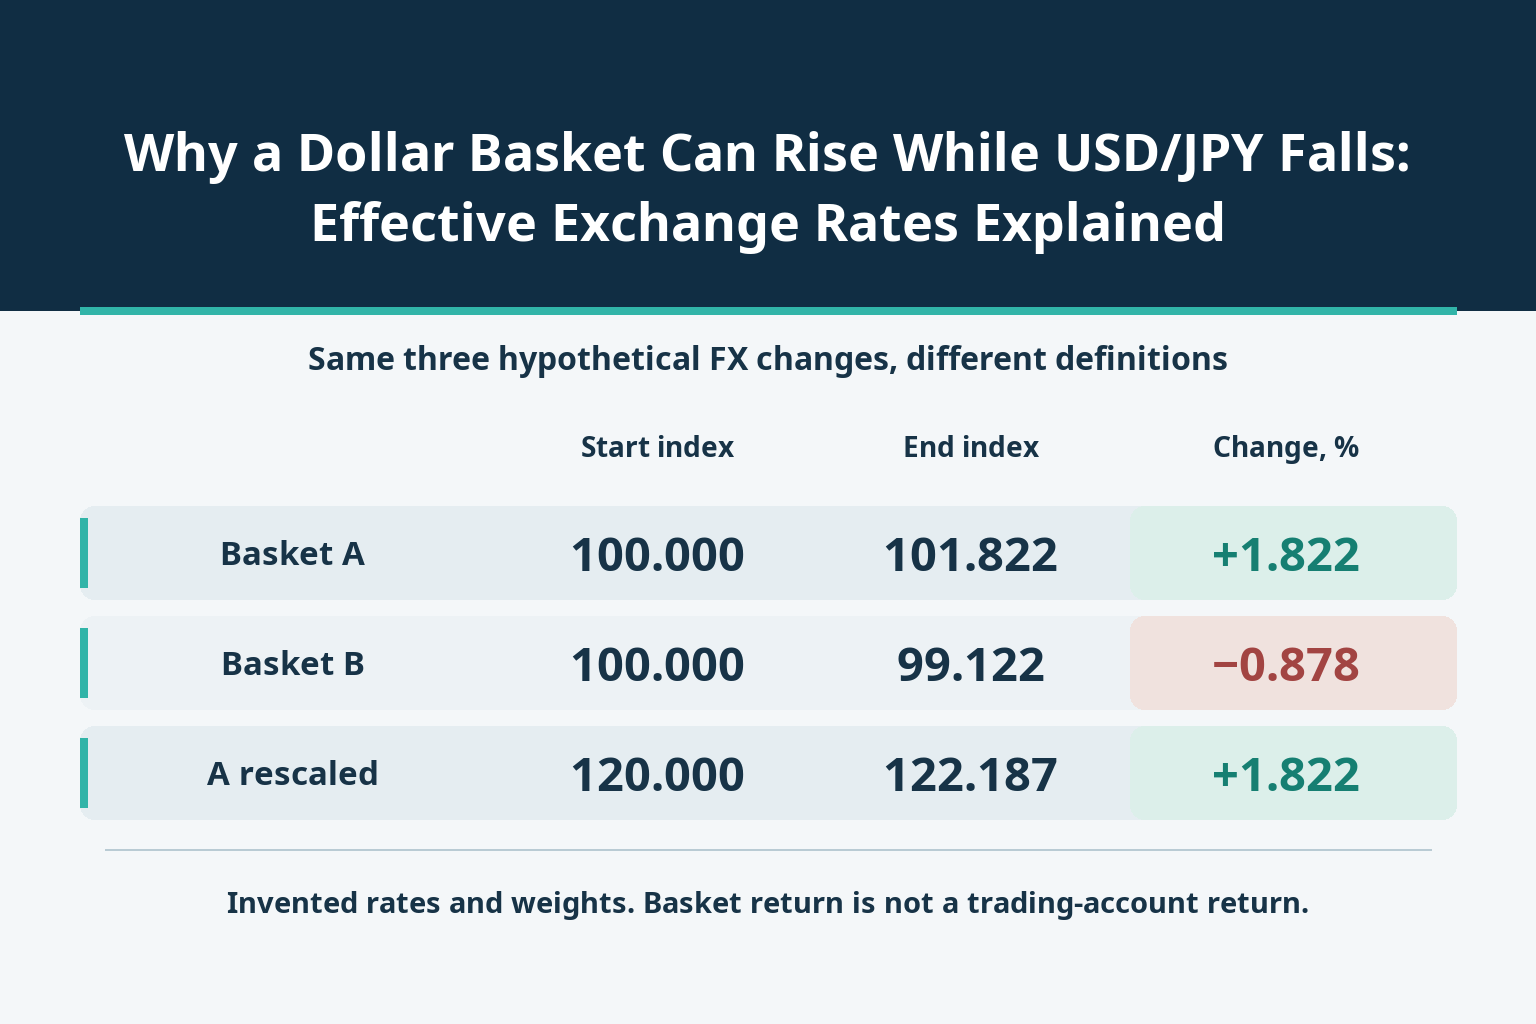
Keep every rate in the first table unchanged, but give Basket B euro, yen and sterling weights of 0.20, 0.60 and 0.20. Its factor becomes 1.05^0.20×0.96^0.60×1.03^0.20 = 0.9912154086. From 100 it falls to 99.1215409, or −0.8784591%. The more heavily weighted yen decline now outweighs the other gains.
| Independent definition | EUR/JPY/GBP weights | Start index | End index | Change, % |
|---|---|---|---|---|
| Basket A | 0.50 / 0.30 / 0.20 | 100.000 | 101.822 | +1.822 |
| Basket B | 0.20 / 0.60 / 0.20 | 100.000 | 99.122 | −0.878 |
| Basket A, all levels ×1.2 | 0.50 / 0.30 / 0.20 | 120.000 | 122.187 | +1.822 |
Baskets A and B describe different weighting choices applied to identical currency moves. Neither sign proves that the other calculation is wrong. These are two alternative definitions over one interval, not an instruction to switch weights halfway through a historical series. For a published index, use the weights applicable to each period and the compiler’s linking method; do not apply today’s weights backward without explaining that a different series is being created.
The third row does something different: it multiplies every level of Basket A by 1.2. Its starting level is therefore 120 and its ending level 122.1869180, while the percentage change remains 1.8224317%. Rescaling the same complete series changes its displayed levels, not its period-to-period movement.
The BIS explicitly cautions that an index above or below 100 does not by itself establish overvaluation or undervaluation. A level relates to a reference base. Comparing 122 on one base with 102 on another is not evidence that the first currency is more expensive. Even with a common base, an index is a relative change measure rather than a valuation model.
Separate a genuine basket difference from an input error
A difference is explained by the basket when the component observations and their time intervals match, the weights are documented and sum to 1, and the weighted products reproduce the reported results. In the example, A and B pass that test: the rates are identical and only the weights change. The dollar’s 4% decline against the yen remains true under both definitions.
A quote-direction error gives a different result for a different reason. If Basket A mistakenly uses the inverse euro ratio 1/1.05 while leaving the other two ratios unchanged, the computed level is approximately 96.9737444 instead of 101.8224317. That apparent decline is not evidence of broader dollar weakness; it comes from mixing dollar-per-euro and foreign-currency-per-dollar inputs.
Other mismatches require the same discipline. A month-average index and an end-of-day currency pair do not cover the same observation window. Nominal and inflation-adjusted indices answer different questions. Revised weights or revised input data can change a historical series. Do not explain every discrepancy as market divergence before checking definitions and data versions.
Reconcile the definition before interpreting the index move
Record the full index name, home currency, nominal or real definition, base reference, observation frequency and applicable weight version. Then list each component’s quote units and align its start and end timestamps. If the precise series or interval is unknown, the claim of a contradiction is not yet testable.
Normalize quote direction, calculate the end/start ratios, verify that the weights sum to 1, and recompute the product using unrounded inputs. Round only the displayed output. For this example, the three rows of the second table must give +1.822%, −0.878% and +1.822% after rounding to three decimal places. Retain more precision in the working calculation so rounded inputs do not accumulate avoidable error.
Finally state what the comparison actually supports. A rising basket establishes appreciation against that weighted basket over that interval; it does not establish a rise against every constituent, an imminent move in a particular pair or a tradable return. To make a decision about one currency pair, return to that pair’s own prices, quantities and execution conditions rather than replacing them with the index headline.


