

CNH–CNY Spread: Why a Narrower Gap Does Not Mean a Stronger Yuan
 Eva Chen
The offshore–onshore yuan gap can narrow while CNH strengthens, CNY weakens or both weaken. Recalculate three paths, separate quote points from relative basis points, and check why the daily central parity is not a live market midpoint.
A smaller gap between USD/CNH and USD/CNY does not, by itself, show that the renminbi has strengthened against the dollar. The two quotes may have moved closer because the offshore yuan strengthened, because the onshore yuan weakened, or because both weakened at different speeds. A spread chart hides which route occurred unless the two underlying prices remain visible.
There is another easy source of error: subtracting a daily official central parity from a live offshore quote and calling the answer the current offshore–onshore market gap. A useful reading starts with the market, quote direction, price type and timestamp. The hypothetical examples below keep those definitions explicit; none of the reference prices is a claim that a customer could execute an exchange at that level.
Read the two markets before reading the sign
CNY and CNH distinguish onshore and offshore markets for the renminbi. The labels do not make the balances in those markets automatically interchangeable on demand. Different funding conditions, access and market connections can support different prices. Here C is a USD/CNY spot reference midpoint and H is a USD/CNH spot reference midpoint, observed at the same time. Each is measured in renminbi per US dollar in its respective market.
Both numbers are positive. A rise in either quote means one dollar costs more renminbi in that market: the renminbi has weakened against the dollar. A fall means the opposite. Keep the location attached to the number even though both observations are expressed in renminbi units. The model compares reference valuations; it does not assume an unrestricted, costless transfer between the two markets.
Define the signed gap as d = H−C. If H is 7.2300 and C is 7.2000, d is +0.0300 renminbi per dollar. The higher offshore dollar quote means the offshore renminbi has the lower dollar reference value. A chart defined as C−H would reverse the sign without changing either underlying observation. Always inspect the formula before interpreting a positive or negative spread.
In these examples a quote point is explicitly 0.0001 renminbi per dollar, making 0.0300 equal to 300 quote points. That definition is a measuring convention for this article, not a claim about every platform’s point, pip or minimum tradable price increment. Each midpoint is assumed to come from its own contemporaneous bid and ask. A midpoint is not a buy or sell price promised to the reader.
Three different paths narrow the gap by the same 200 quote points
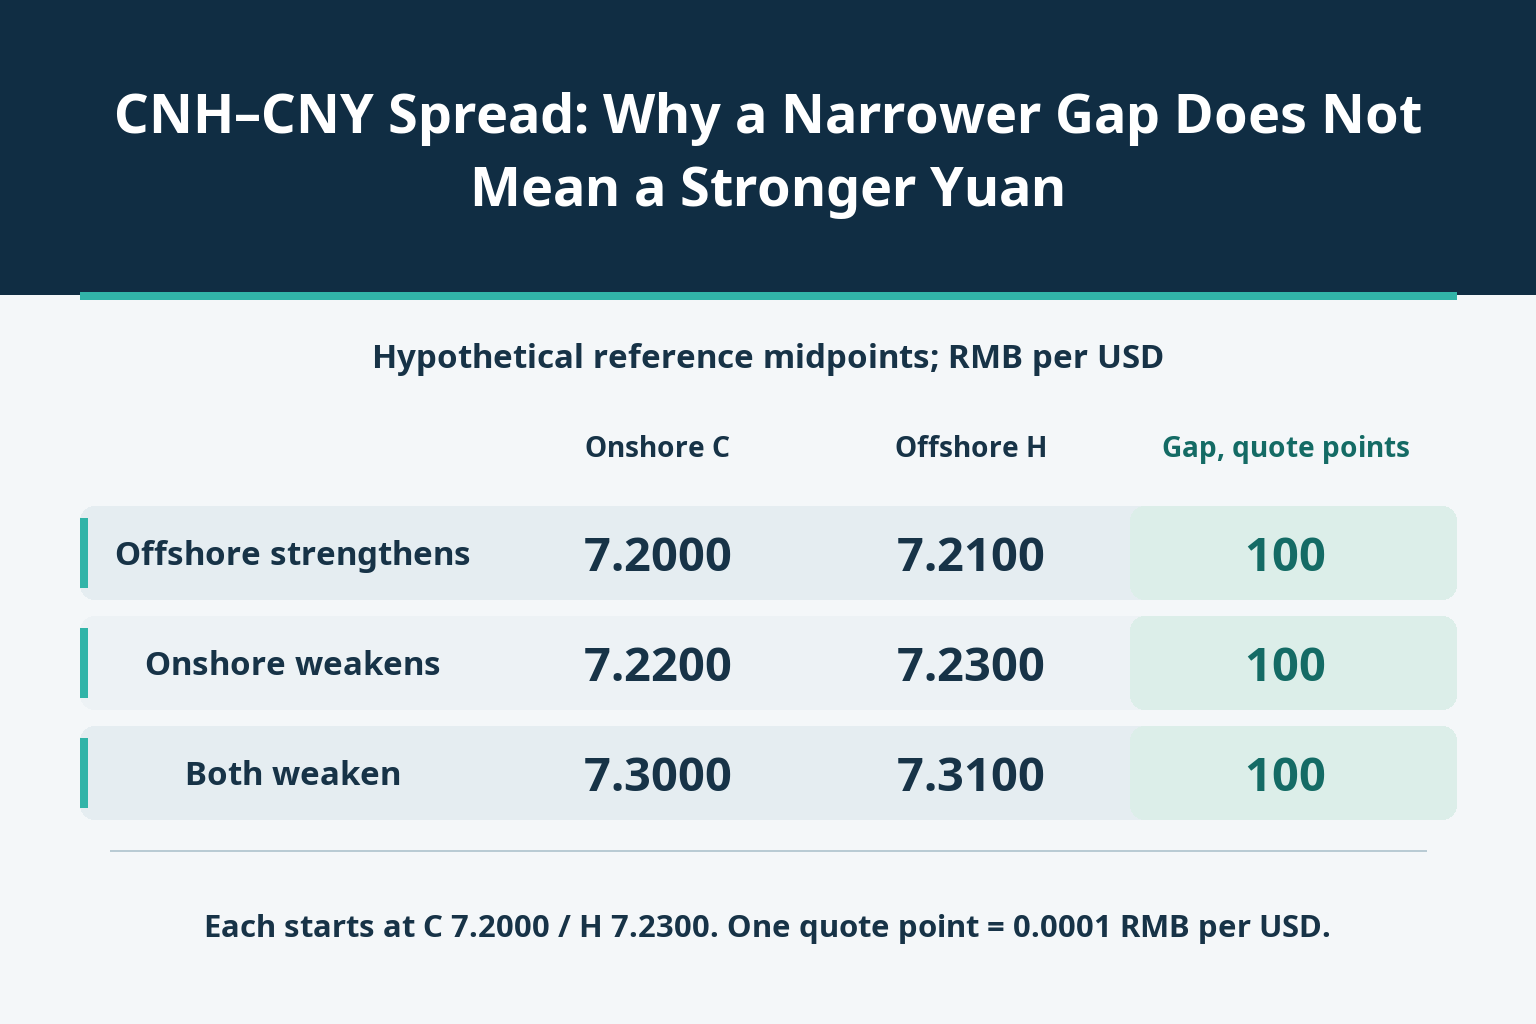
Start from the common reference C = 7.2000 and H = 7.2300, a gap of 300 quote points. Each later row below is a separate hypothetical outcome relative to that starting point. They are not a sequence of trades or a reconstructed market session.
| Independent outcome | C: onshore RMB per USD | H: offshore RMB per USD | Gap, quote points | Renminbi direction versus USD |
|---|---|---|---|---|
| Common starting point | 7.2000 | 7.2300 | 300 | Offshore reference value lower |
| A | 7.2000 | 7.2100 | 100 | Offshore strengthens; onshore unchanged |
| B | 7.2200 | 7.2300 | 100 | Onshore weakens; offshore unchanged |
| C | 7.3000 | 7.3100 | 100 | Both weaken |
In A, only the offshore quote falls, so the offshore renminbi strengthens. In B, only the onshore quote rises, so the onshore renminbi weakens. In C, both dollar quotes rise: the renminbi weakens in both markets, but the onshore dollar quote rises more. All three gaps finish at +0.0100, or 100 quote points.
The reconciliation is Δd = ΔH−ΔC. For A it is −0.0200−0 = −0.0200; for B, 0−0.0200 = −0.0200; for C, 0.0800−0.1000 = −0.0200. The same 200-point reduction therefore carries three different dollar-direction stories. A narrower positive gap describes closer relative pricing, not a standalone bullish signal for the renminbi.
A sign change needs separate attention. If d moves from +0.0300 to −0.0400, its signed value has fallen, but the absolute distance has increased from 0.0300 to 0.0400. Calling that entire move “convergence” would be wrong. Specify whether the comparison concerns a positive gap, |d|, or a normalized absolute gap.
Quote points and relative basis points are different measurements
The point count is p = d/0.0001. A different statistic normalizes by the onshore dollar quote: q = 10000d/C, expressed in basis points of a ratio. At the starting prices, q = 10000 × 0.0300/7.2000 = 41.666667 basis points, or 0.416667%. Thus 300 quote points are neither 300 return basis points nor a 3% gain. q is a relative price statistic, not an interest rate, trading return or fee.
At the three 100-point outcomes, q is 13.888889 basis points in A, 13.850416 in B and 13.698630 in C. The numerator is the same, but the onshore denominator is not. Similar-looking spread charts can disagree simply because one displays raw quote points and another displays a percentage; their definitions must remain unchanged through the comparison.
The difference can even reverse the apparent direction. In another independent outcome, C = 7.5600 and H = 7.5910. The raw gap is 0.0310, or 310 quote points, wider than the original 300. Yet q = 10000 × 0.0310/7.5600 = 41.005291 basis points, below the original 41.666667. The denominator has grown enough to reduce the relative measure. Neither calculation is wrong, but they answer different questions.
Even the percentage’s numerator currency matters. Initially H/C−1 is +0.416667%: the offshore dollar reference quote is that much higher relative to the onshore quote. Comparing the dollar reference value of one renminbi in each market instead gives (1/H)/(1/C)−1 = C/H−1 = −0.414938%. That is a contemporaneous relative valuation, not a holding-period return or an executable CNH/CNY cash-conversion rate.
Do not substitute the official central parity for the current onshore midpoint
The daily official central parity is formed through a specified process using market-maker submissions and other prescribed inputs. It is not simply the arithmetic average of the live bid and ask on a screen. A live market midpoint and the official central parity can both be valid observations while serving different purposes.
Let F be an official central parity published earlier in a hypothetical day. C and H below are spot reference midpoints from the same later snapshot and timezone. The numbers and observation time are illustrative, not a record of an actual fixing or trading day.
| Input | Illustrative observation | RMB per USD | Price type |
|---|---|---|---|
| F | Earlier publication | 7.1800 | Official central parity |
| C | 10:00:00, same timezone | 7.2000 | Onshore spot reference midpoint |
| H | 10:00:00, same timezone | 7.2300 | Offshore spot reference midpoint |
Subtracting F from H gives 7.2300−7.1800 = 0.0500, or 500 quote points. But the simultaneous offshore–onshore spot gap is H−C = 0.0300, or 300 points. The other 200 points come from C−F = 0.0200: the current onshore reference quote’s difference from the earlier official benchmark.
The exact identity is H−F = (H−C)+(C−F) = 0.0300+0.0200 = 0.0500. It does not establish that the official benchmark is wrong or that the market is being manipulated. It establishes that “offshore versus central parity” and “offshore versus onshore spot” are not the same comparison. Likewise, mixing a current quote with yesterday’s close adds a time difference that cannot be labeled a simultaneous market gap.
A price gap is a question about markets, not proof of an arbitrage
The onshore and offshore markets have different pools of demand and supply and can face different liquidity and funding conditions. Their connections matter too: the existence of two reference prices does not establish that a particular participant can move funds between the markets in the required amount and time. Offshore pricing is not synonymous with immunity from policy or liquidity arrangements, and the onshore spot price is not simply a copy of the daily central parity.
These mechanisms explain why a gap can exist without identifying the cause of one observation. The gap alone does not measure capital outflows, prove a policy intention or tell which quote will catch up with the other. A wider or more volatile gap can motivate checking liquidity and funding evidence; it cannot replace that evidence. No fixed convergence time follows from the arithmetic.
Multiplying the reference gap by a dollar amount does not turn it into a net trading profit. An executable comparison needs prices actually available to the same participant, the correct bid and ask, sufficient size, compatible settlement dates, permitted transfers and all relevant funding and transaction costs. Without a completed executable route, there is no verified arbitrage. This article assumes no ability to bypass market-access or transfer conditions.
A product labeled with a renminbi pair might be a deliverable spot transaction, a non-deliverable forward, a future or a margined derivative. Their prices and settlement obligations cannot be substituted without checking the contract. Nor is buying USD/CNH a purchase of the renminbi in the quote’s usual direction: the base currency being bought is the dollar.
Audit the two original prices, then interpret the gap
First preserve C and H as separate observations, not just their difference. Record the source, market, timestamp and timezone, quote direction, price type, amount and value-date definition. Verify whether the field is a live bid, ask, midpoint, prior close, official central parity or a derivative reference. Match the inputs before applying a formula.
Next compute d using one unchanged sign convention. State the quote-point size, and label a normalized ratio separately if using q. For convergence, inspect the relevant absolute distance when the sign crosses zero. Then use Δd = ΔH−ΔC to determine whether each market’s renminbi reference value strengthened, weakened or stayed unchanged against the dollar.
If an official central parity is part of the analysis, retain it as a separate F series. Do not silently replace the current onshore spot midpoint with F. If the quote direction is reversed, consult how reversing an exchange-rate quote changes the percentage calculation; swapping the numerator and denominator changes both the sign interpretation and the percentage calculation, not the underlying market observation.
Finally separate description from attribution and execution. Synchronized reference prices can verify a measured gap, but a claim about its cause needs additional evidence, and a claim about a trade needs executable terms. Where one timestamp, price definition or market-access condition is missing, leave that conclusion unresolved. The defensible result is the specific comparison the data supports—not an automatic forecast of a stronger yuan.


