XBR/USD Chart Analysis: Geopolitics Are Once Again Driving Brent Crude Prices
 Dark Current
On 21 November, we outlined a descending channel on the XBR/USD chart and noted that the bearish trend had been fuelled by easing geopolitical risks and hopes for an end to the war in Ukraine.
On 21 November, we outlined a descending channel on the XBR/USD chart and noted that the bearish trend had been fuelled by easing geopolitical risks and hopes for an end to the war in Ukraine.
Ten days later, Brent crude is now trading above its late-November highs — once again driven by geopolitical developments.
Why is Oil Rising?
US President Donald Trump stated that the airspace over and around Venezuela "should be considered completely closed". This immediately led to flight cancellations, created a de facto blockade, and raised the threat of military action in an oil-rich region. This risk premium is being priced into the current rally.
In addition, OPEC+ members have confirmed they will postpone the production increases planned for early 2026 — setting the stage for a potential supply deficit, especially if Venezuelan exports are disrupted.
XBR/USD Technical Analysis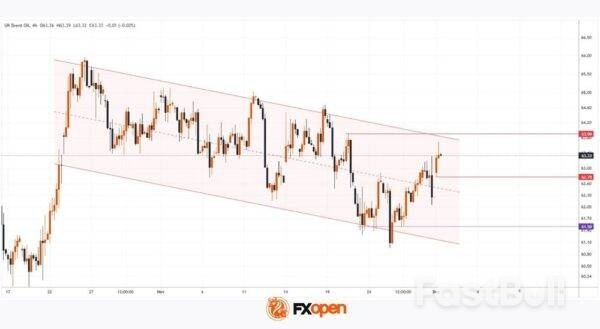
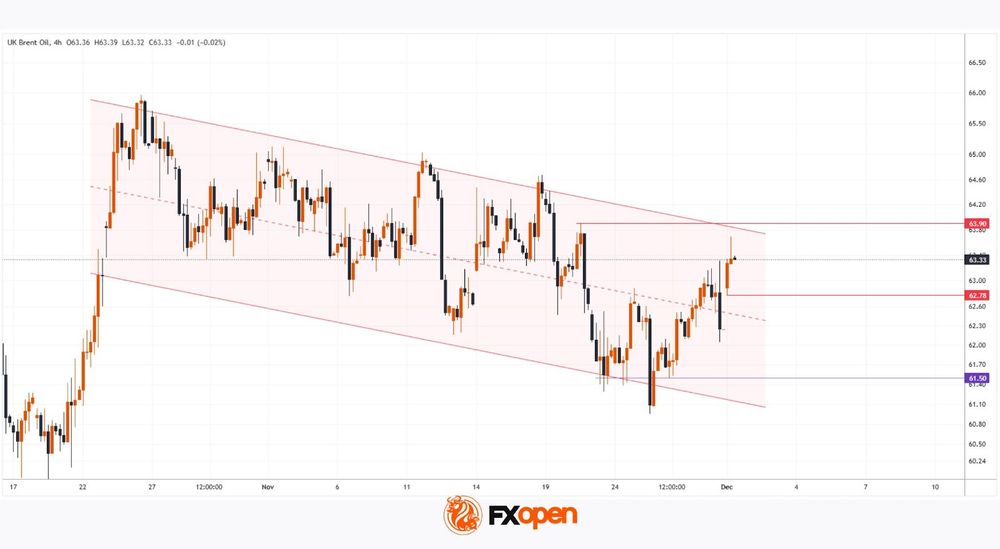
Although there was no further downside extension, the descending channel remains valid. The downward move was met with strong buying interest (evident from the long lower wicks on candles in late November around $61.50), triggering an upward reversal from the channel's lower boundary.
This week opened with a bullish gap, followed by a large bullish candle on the 4-hour chart — a sign of limited selling pressure and market expectations of higher prices.
However, Brent's advance may soon stall due to nearby resistance zones:
→ around $63.90 (the 20 November high);
→ at the upper boundary of the channel.
Should sellers regain control, support may be found in the area between:
→ the channel's median line;
→ the lower edge of the gap at $62.78.


