Weekly Technical Analysis And Forecast (29 December 2025–2 January 2026)
 Justin
This weekly technical analysis highlights the key chart patterns and levels for EURUSD, USDJPY, GBPUSD, AUDUSD, USDCAD, gold (XAUUSD), and Brent crude oil to forecast market moves for the upcoming week (29 December 2025–2 January 2026)
This weekly technical analysis highlights the key chart patterns and levels for EURUSD, USDJPY, GBPUSD, AUDUSD, USDCAD, gold (XAUUSD), and Brent crude oil to forecast market moves for the upcoming week (29 December 2025–2 January 2026)
Major technical levels to watch this week
EURUSD forecast
The market remains focused on the combination of expectations for faster US economic growth (GDP forecast up to 4.5%) alongside rising political and institutional risks.
Strong US macro expectations provide baseline support for the dollar. However, uncertainty around a possible shutdown in early January partially offsets this impact, which restrains steady demand for USD and increases short-term volatility.
A flare-up in geopolitical tensions in the Caribbean adds another risk factor, which boosts demand for safe-haven assets and increases nervousness in the FX market. In these conditions, the euro keeps the character of a corrective rebound rather than the start of a new medium-term growth trend.
Overall, the fundamental backdrop remains mixed: strong expectations for the US economy limit EURUSD upside potential, while political risks and geopolitics support corrective moves upwards.
EURUSD technical analysis
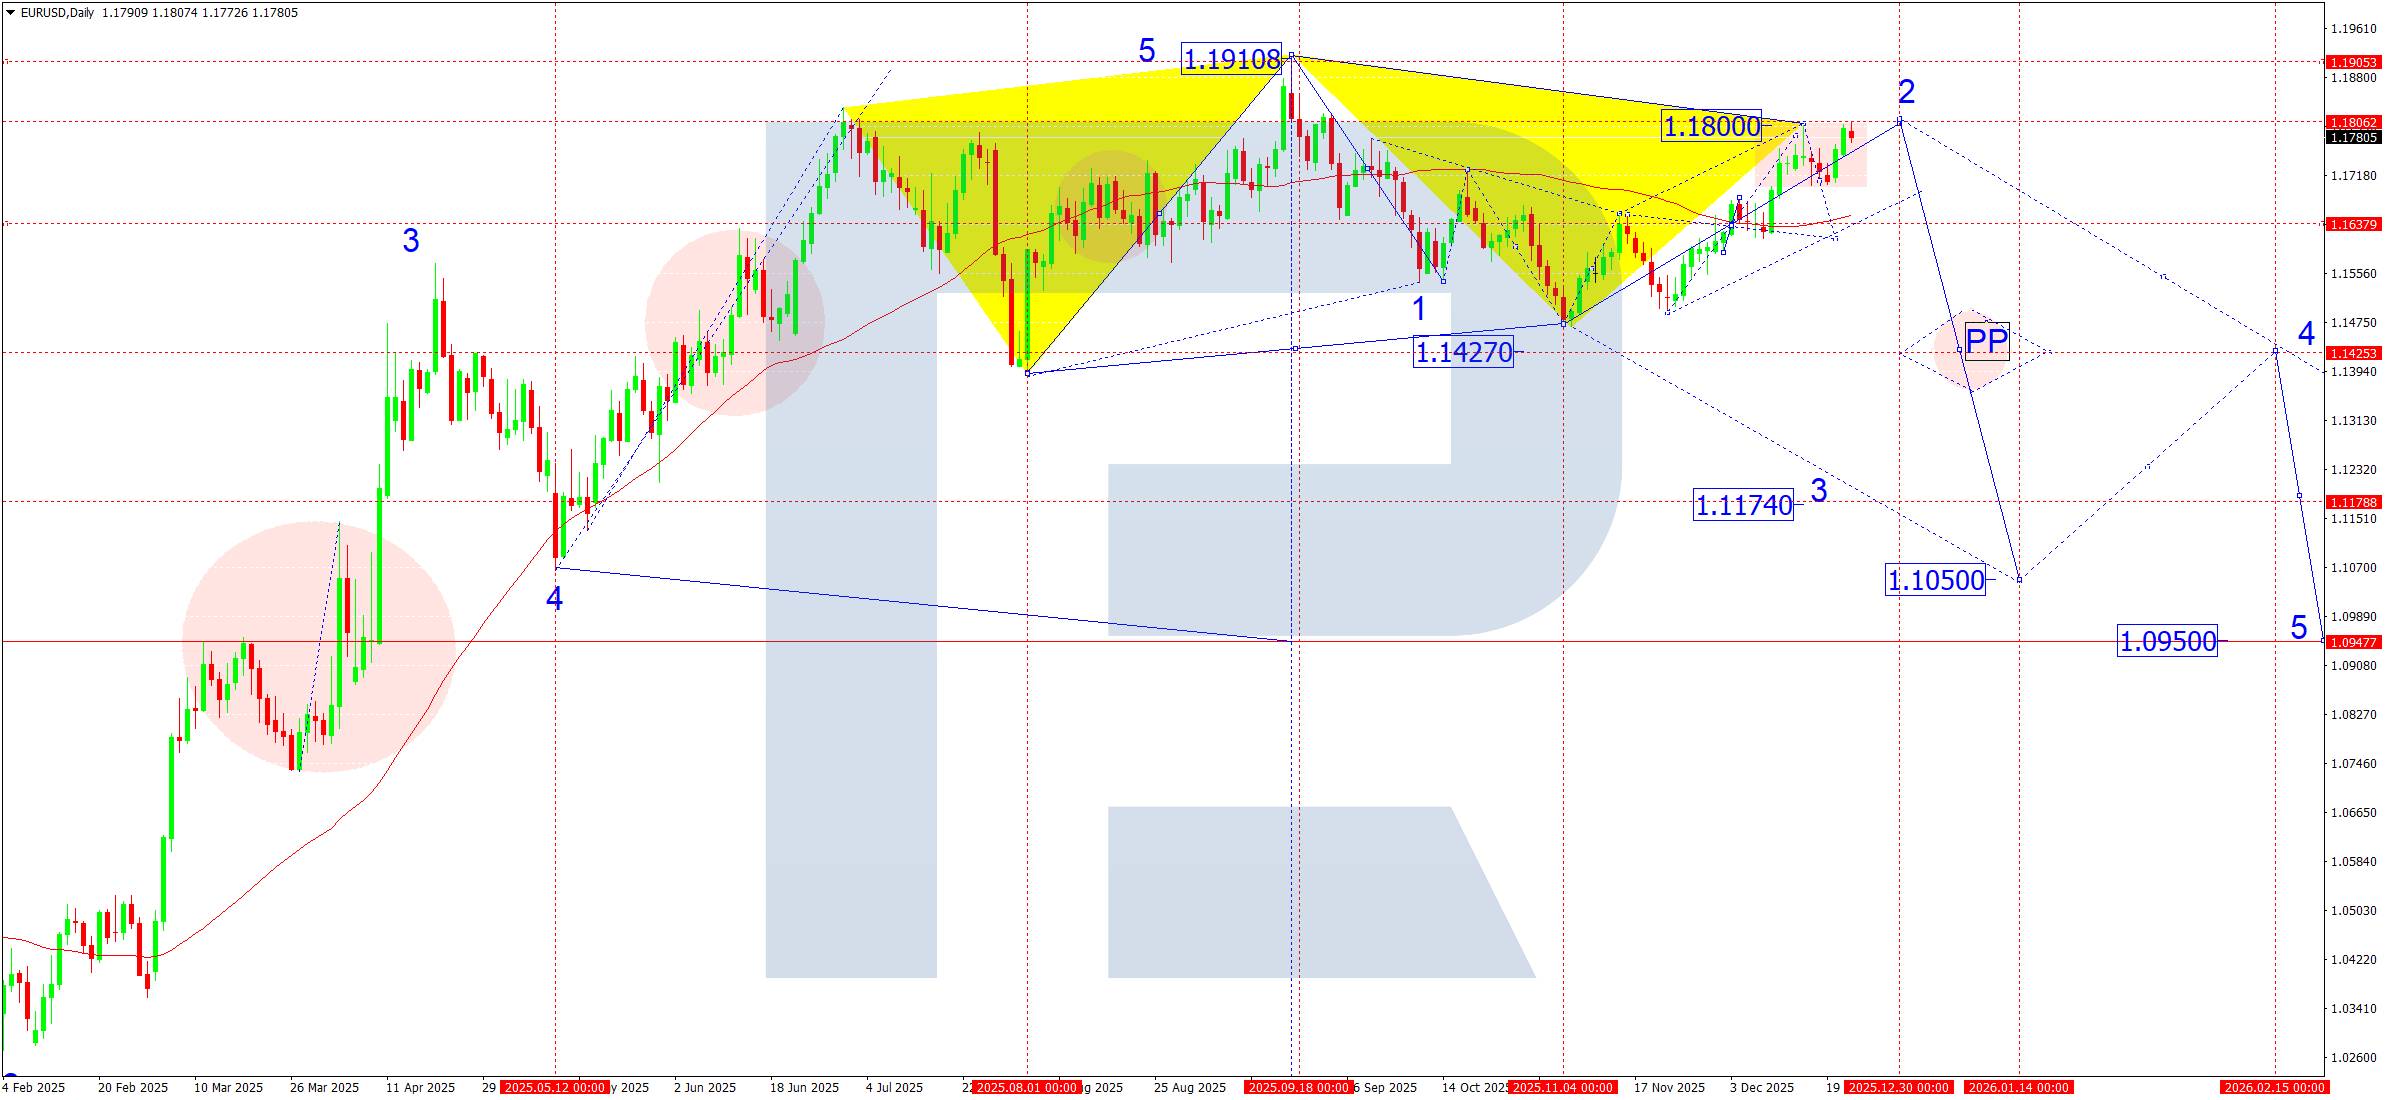
On the daily EURUSD chart, the market formed a compact consolidation range around 1.1638 and then continued to develop a corrective growth wave after an upside breakout.
The market has now met the local correction target at 1.1800, where it has moved into a slowdown phase and started to form a range.
Over the coming week, the baseline scenario remains the formation of a downward leg to 1.1638 (a test from above). This level acts as a key zone for assessing buyers' strength.
If the market holds support at 1.1638, it may develop another corrective growth wave to 1.1828, where the current wave structure suggests this correction will exhaust its potential.
After this phase ends, priority shifts towards a decline to 1.1425 as the next medium-term target.
EURUSD forecast scenarios
Bearish scenario (baseline): the market is forming a consolidation range below 1.1800.
With a downside breakout, the market will open potential to fall to 1.1638–1.1640.
Bullish (alternative, unlikely): if the market breaks above 1.1800 on rising volumes, then we can consider the probability of the wave continuing to 1.1828.
USDJPY forecast
At year-end, USDJPY has entered a low-liquidity phase, which increases the likelihood of sharp, impulsive moves inside established ranges.
From a fundamental perspective, the yen remains under pressure due to diverging monetary policy: #.the Fed keeps a hawkish tone, while the Bank of Japan continues to act with maximum caution, limiting itself to selective verbal interventions.
#.The geopolitical backdrop and investors' general preference for dollar liquidity under elevated risks add another uncertainty factor. At the same time, any signs of falling US Treasury yields or stronger demand for safe-haven assets may trigger a deeper USDJPY correction.
USDJPY technical analysis
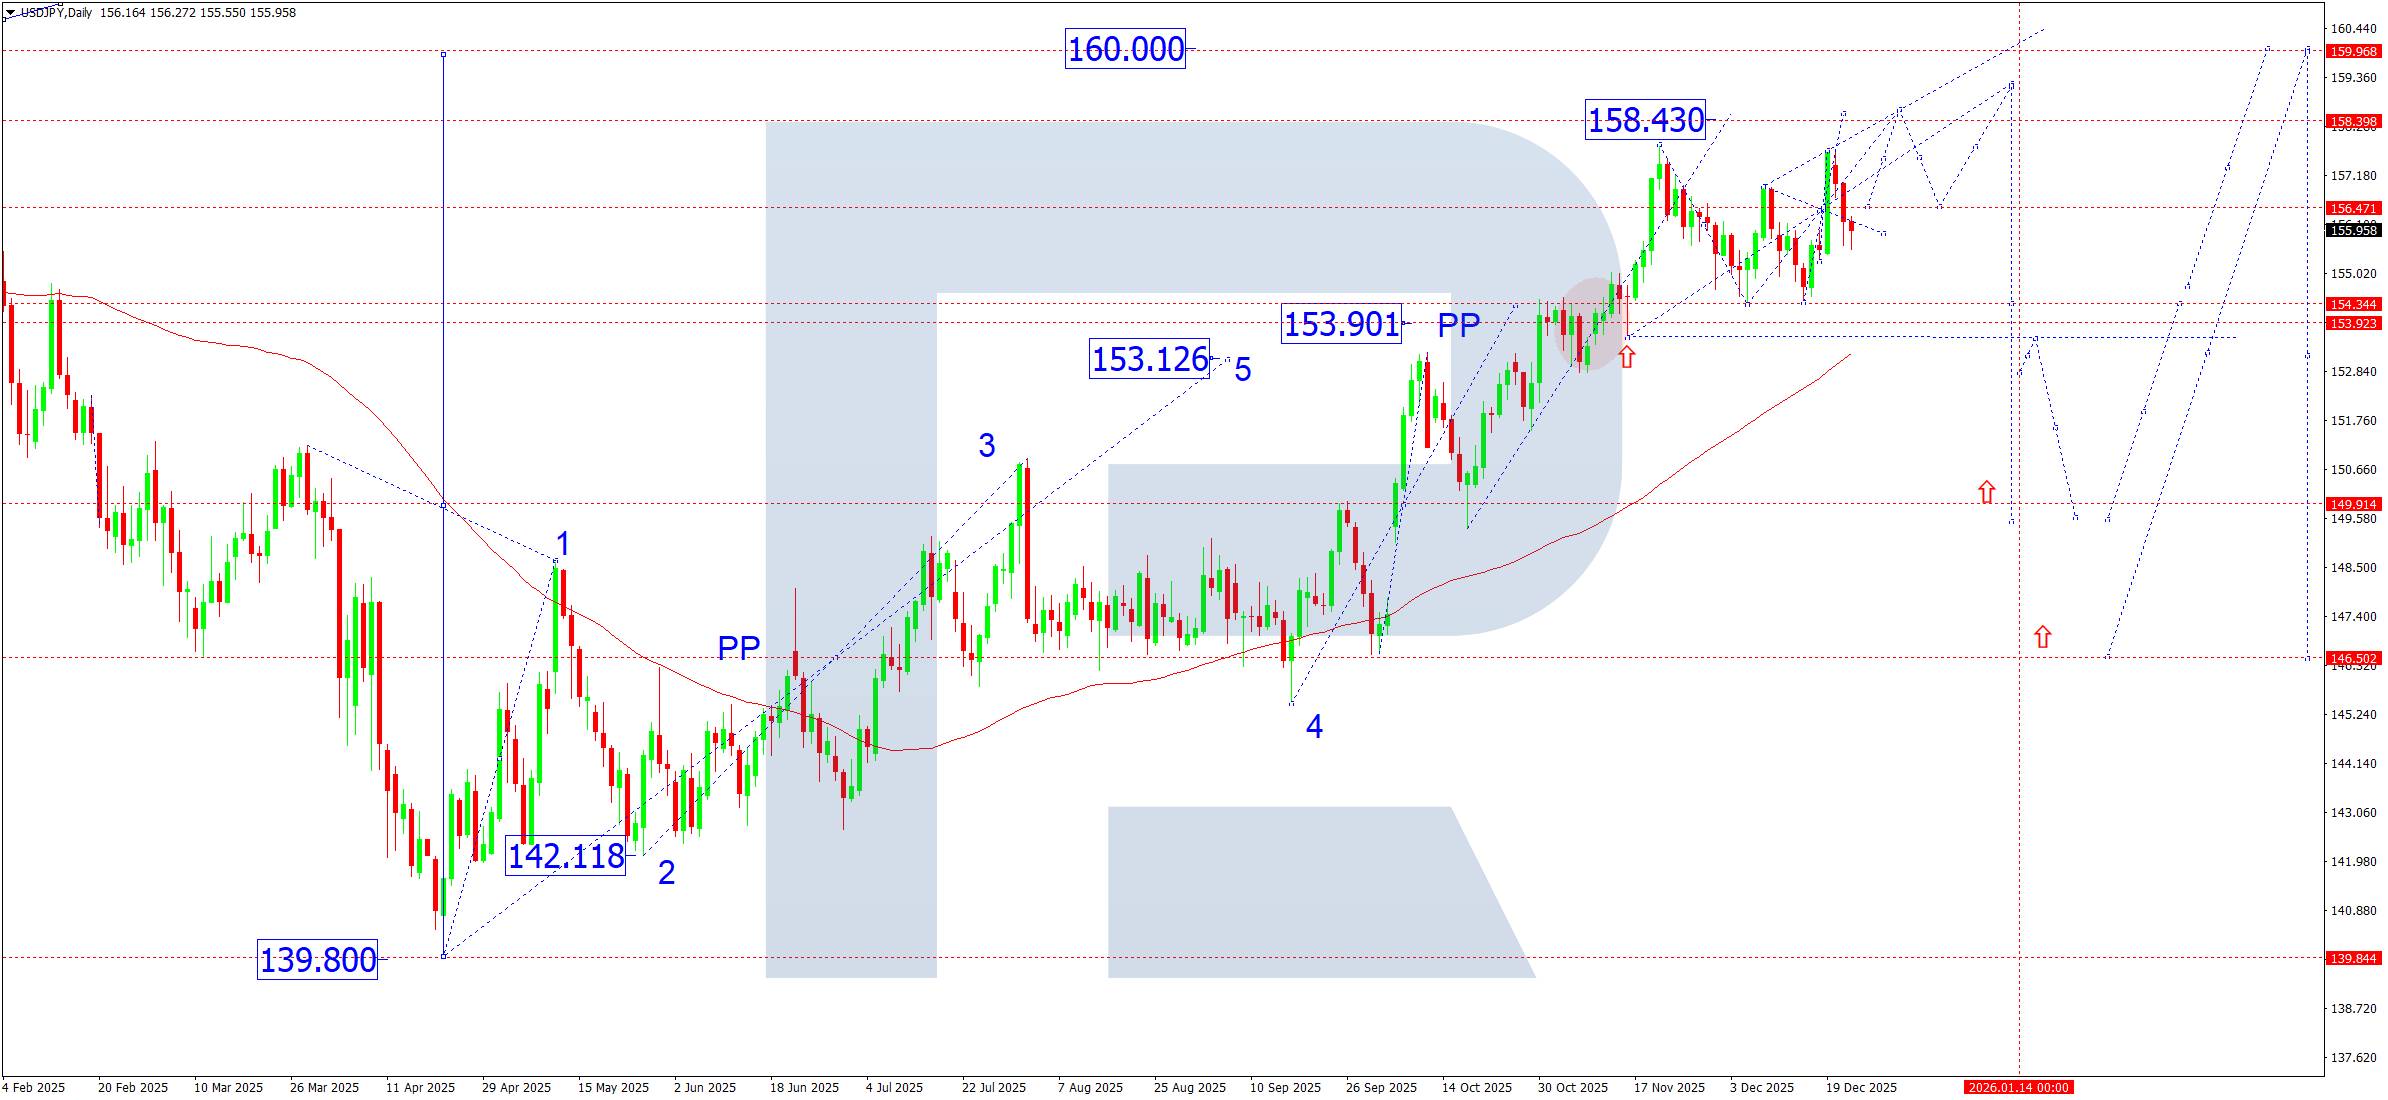
On the daily chart, the market continues to form a wide consolidation range around 156.47, which signals a distribution phase inside an upwards structure.
After reaching the local high near 158.43, the market moved sideways with signs of a weakening impulse. In the short term, the market may develop a corrective leg with a decline to the 155.15 area, where the nearest support zone and the lower boundary of the local range sit.
If the market holds this zone, it will keep the potential to resume the growth wave with a retest of 158.43 and the prospect of stretching the impulse towards 159.15.
If the market breaks the key support at 154.40, we will treat it as a break of the current structure and confirmation of a transition to a deeper correction phase.
USDJPY forecast scenarios
Bearish scenario (main): a sharp decline and a break below 154.40 will create conditions for a corrective wave with targets near 149.90, which will match a broader redistribution phase within the medium-term structure.
Bullish scenario (alternative): firm consolidation above 156.50 will open potential to continue the growth wave to 158.43. If the impulse strengthens, the market may also hit the 159.15 target.
GBPUSD forecast
Year-end and early January traditionally bring lower liquidity and higher market sensitivity to news flow. For sterling, key factors remain expectations around Bank of England monetary policy, as well as the general condition of the US dollar against the background of macro expectations for early 2026.
The market still prices in a scenario where the Fed gradually softens its rhetoric in the first half of the year, which limits the dollar's strengthening potential. At the same time, sterling keeps a moderately positive backdrop, but without clear drivers for sustained impulsive growth. As a result, GBPUSD remains in a medium-term balancing mode, with technical factors taking priority.
GBUSD technical analysis
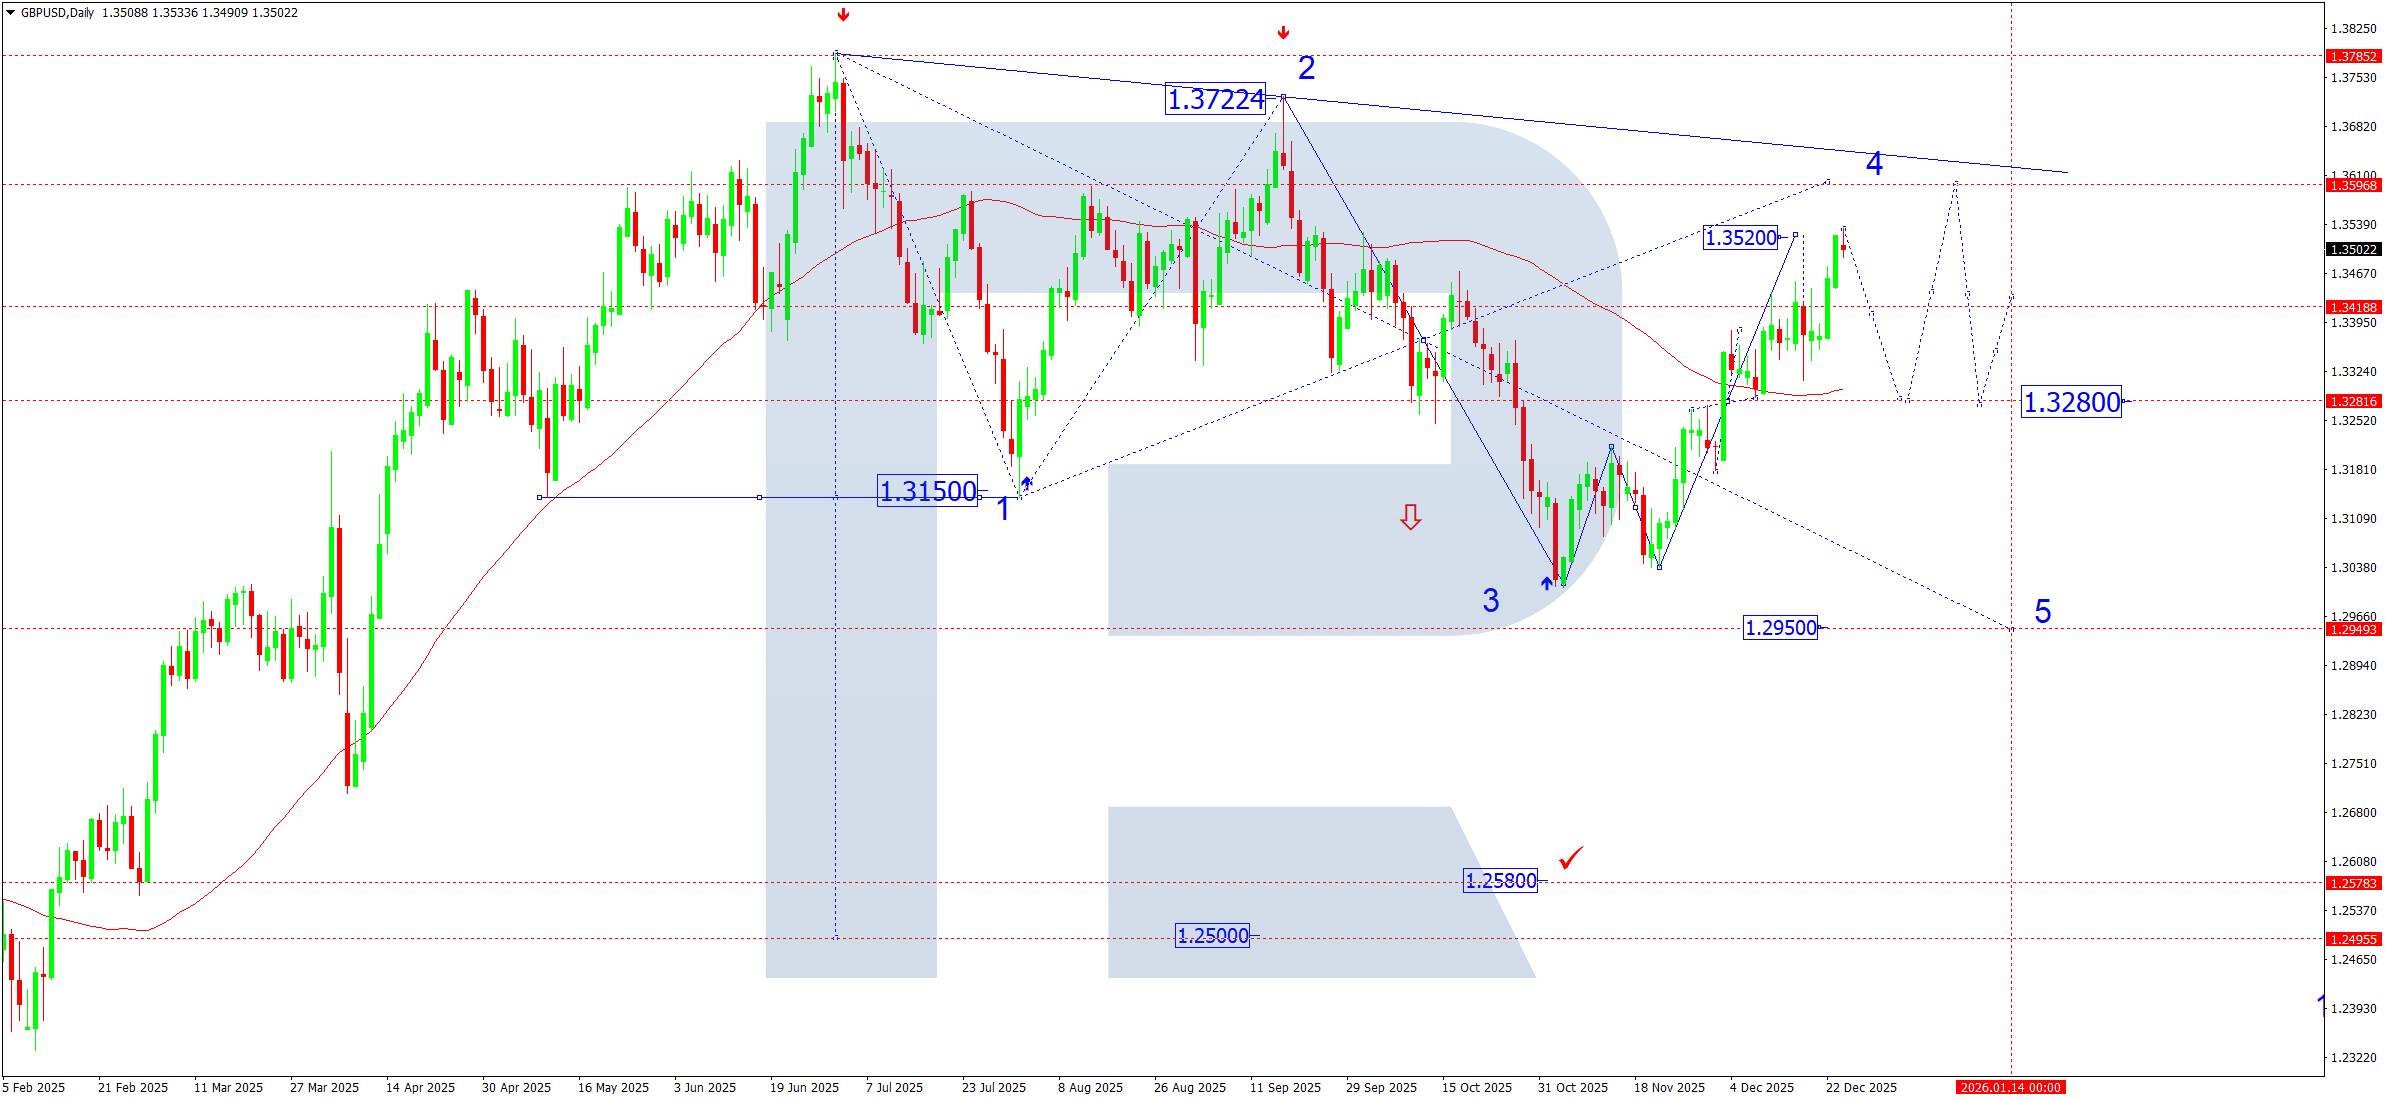
On the daily GBPUSD chart, the market formed a consolidation range structure around 1.3280 last week. An upside breakout allowed the market to meet the local target of the growth wave at 1.3520, which matches the previously marked projection.
In the current phase, the upwards move looks complete within the local structure. Over the coming week, the priority shifts to a scenario of corrective decline to 1.3280, which acts as a test of the support zone from above. This level remains key to keeping the medium-term bullish structure intact.
If the market holds 1.3280 and forms a reversal pattern, it will gain grounds to develop another growth wave with the target area at 1.3600. Until the market confirms this scenario, we treat the move as corrective within a broader consolidation.
GBPUSD forecast scenarios
Bearish (main): the market is likely to start developing a corrective down structure with the target at 1.3280. The move acts as a pullback after reaching the local high.
Bullish (alternative): if the market breaks and consolidates firmly above 1.3550, it will signal a resumption of the upwards move with the growth wave developing towards 1.3600.
AUDUSD forecast
At this stage, the Australian dollar remains under pressure from a combination of external factors, despite local recovery attempts.
The key driver remains the monetary policy differential. The market continues to price in a tougher and longer Fed stance amid persistent inflation and strong macro data. This supports the dollar and limits the growth potential of higher-yielding currencies, including AUD.
From Australia, the fundamental backdrop looks neutral-to-weak. Economic activity remains moderate, and the RBA keeps a wait-and-see stance, avoiding signals of additional tightening. This reduces the Australian dollar's appeal amid global demand for safe-haven assets.
China's dynamics add further pressure as Australia's key trading partner. Slow Chinese economic recovery and uncertainty in the property sector restrain demand for commodity assets and indirectly cap AUD upside potential.
In low-liquidity conditions at year-end and early January, the market tends to form ranges and false breakouts. This increases the importance of technical levels and a scenario-based approach.
AUDUSD technical analysis
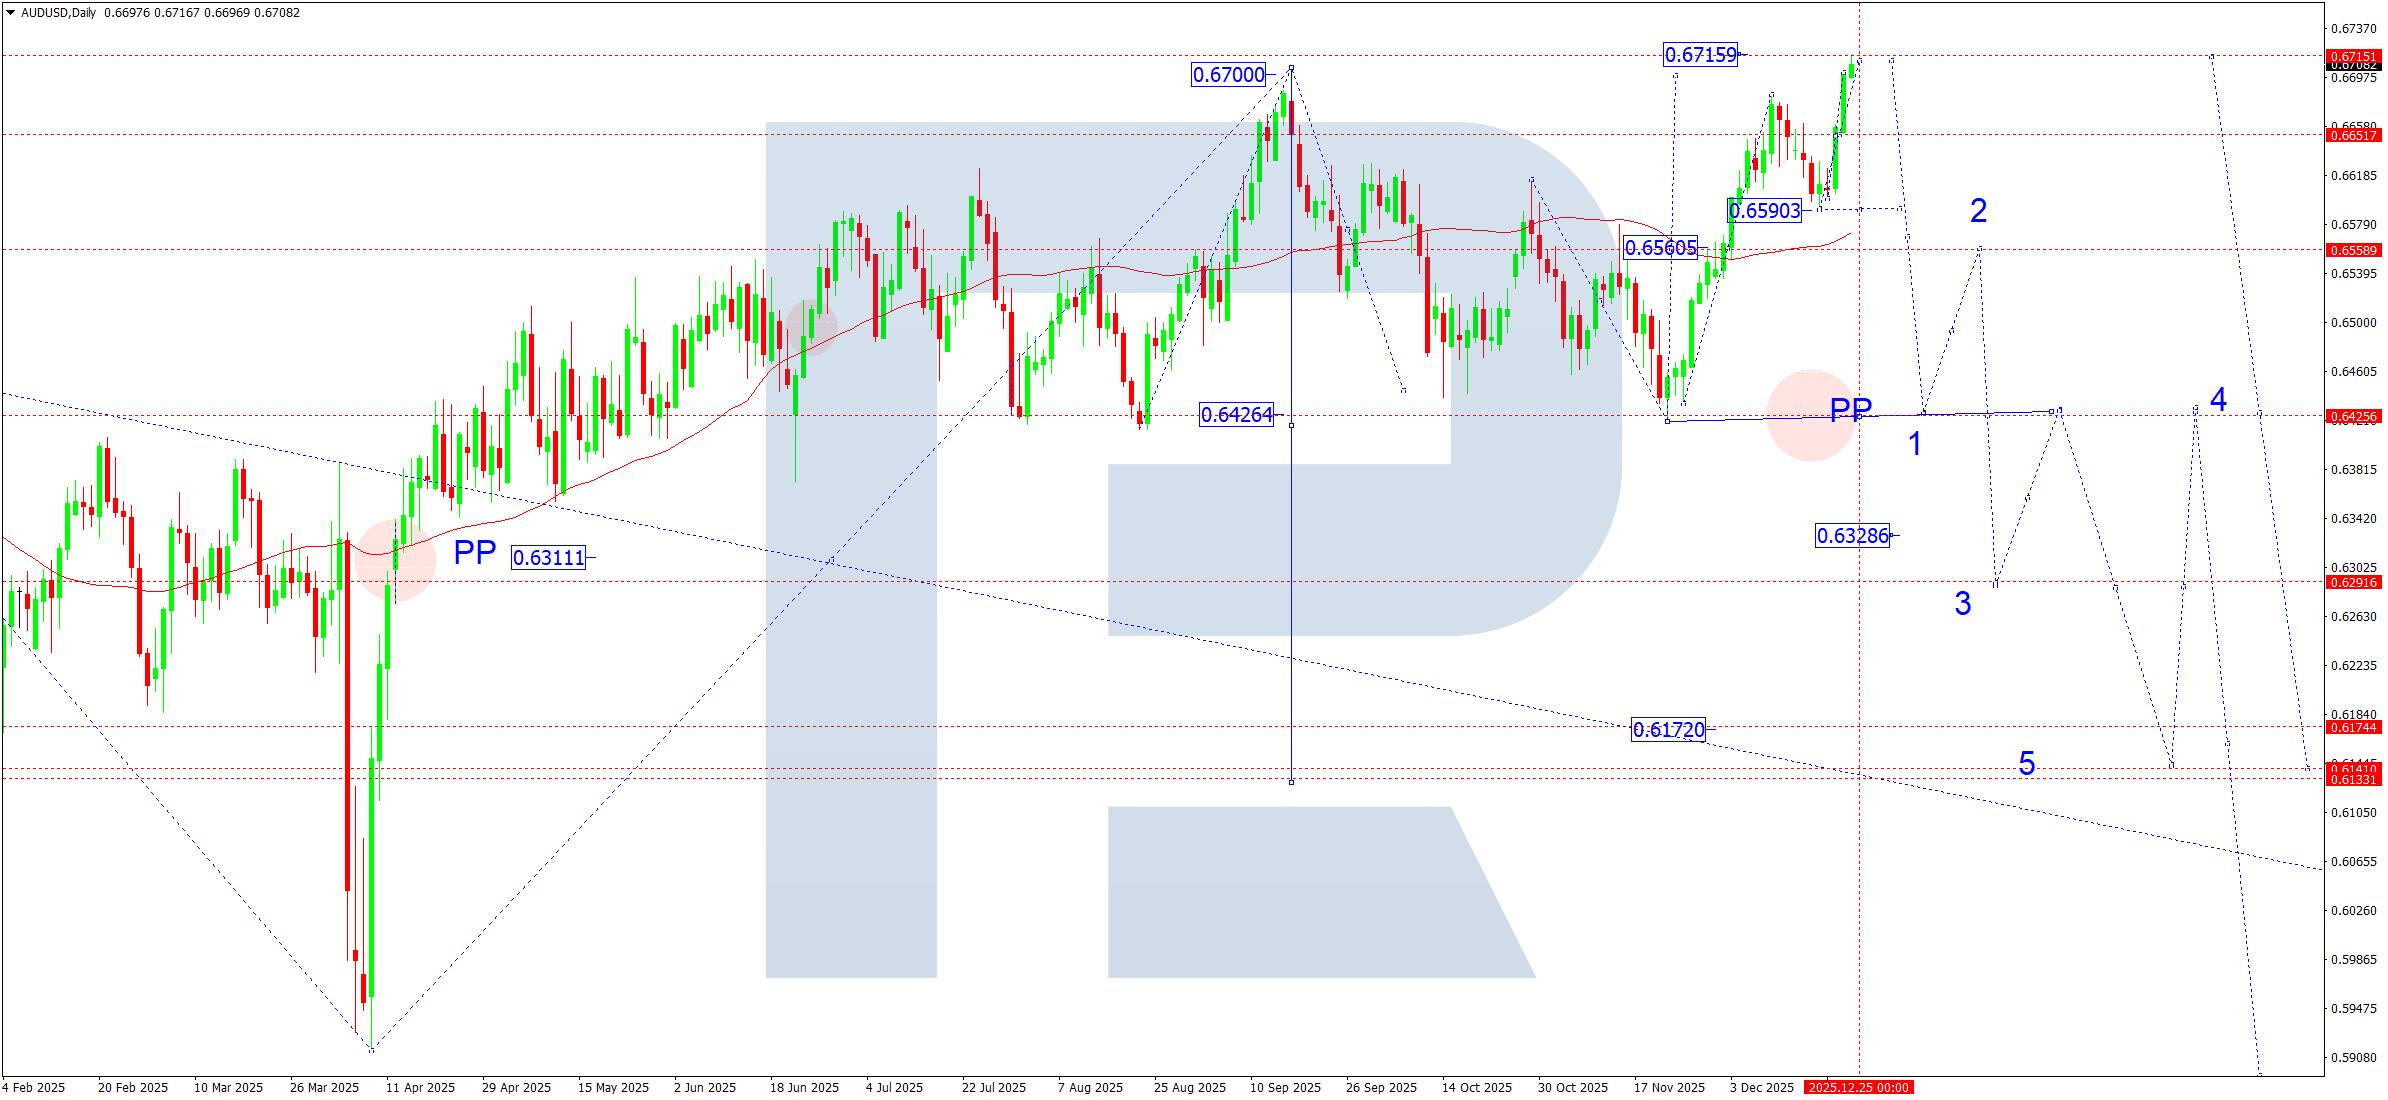
On the daily chart, AUDUSD formed a consolidation range around 0.6560 and, after an upside breakout, completed a growth wave to the calculated target at 0.6716.
Over the coming week, the baseline scenario remains the formation of a downward leg to 0.6560 (a test from above). This zone acts as a key area for assessing the market's next structure.
After testing 0.6560, the market may attempt a corrective rebound to 0.6630, which may effectively define the boundaries of a new consolidation range.
A downside breakout from this range will signal the resumption of the downtrend with potential to move into the 0.6424 area.
The overall market structure keeps a bearish bias, and the market treats growth mainly as corrective.
AUDUSD forecast scenarios
Bearish (main): we expect a decline to 0.6560, followed by a downside breakout and the downtrend developing towards 0.6424.
Bullish (alternative): a confident break and consolidation above 0.6720 will open potential for growth continuation into the 0.6750 area. However, this scenario requires confirmation by an impulse and remains less likely.
USDCAD forecast
In late December and early January, trading activity in USDCAD remains subdued due to the holiday period, which increases the likelihood of range structures and false breakouts.
From a fundamental perspective, the pair's dynamics still largely depend on:
#.oil price swings, which directly influence the Canadian dollar;
#.expectations for the future path of interest rate policy from the Fed and the Bank of Canada;
#.overall demand for the US dollar as a safe-haven asset amid ongoing geopolitical tensions.
Oil price stabilisation or growth will strengthen CAD and support a bearish scenario for USDCAD with potential for the downward wave to continue.
If the oil market weakens and demand for the US dollar recovers, the pair may develop corrective growth towards 1.3900, which fits the baseline scenario for the coming week.
USDCAD technical analysis
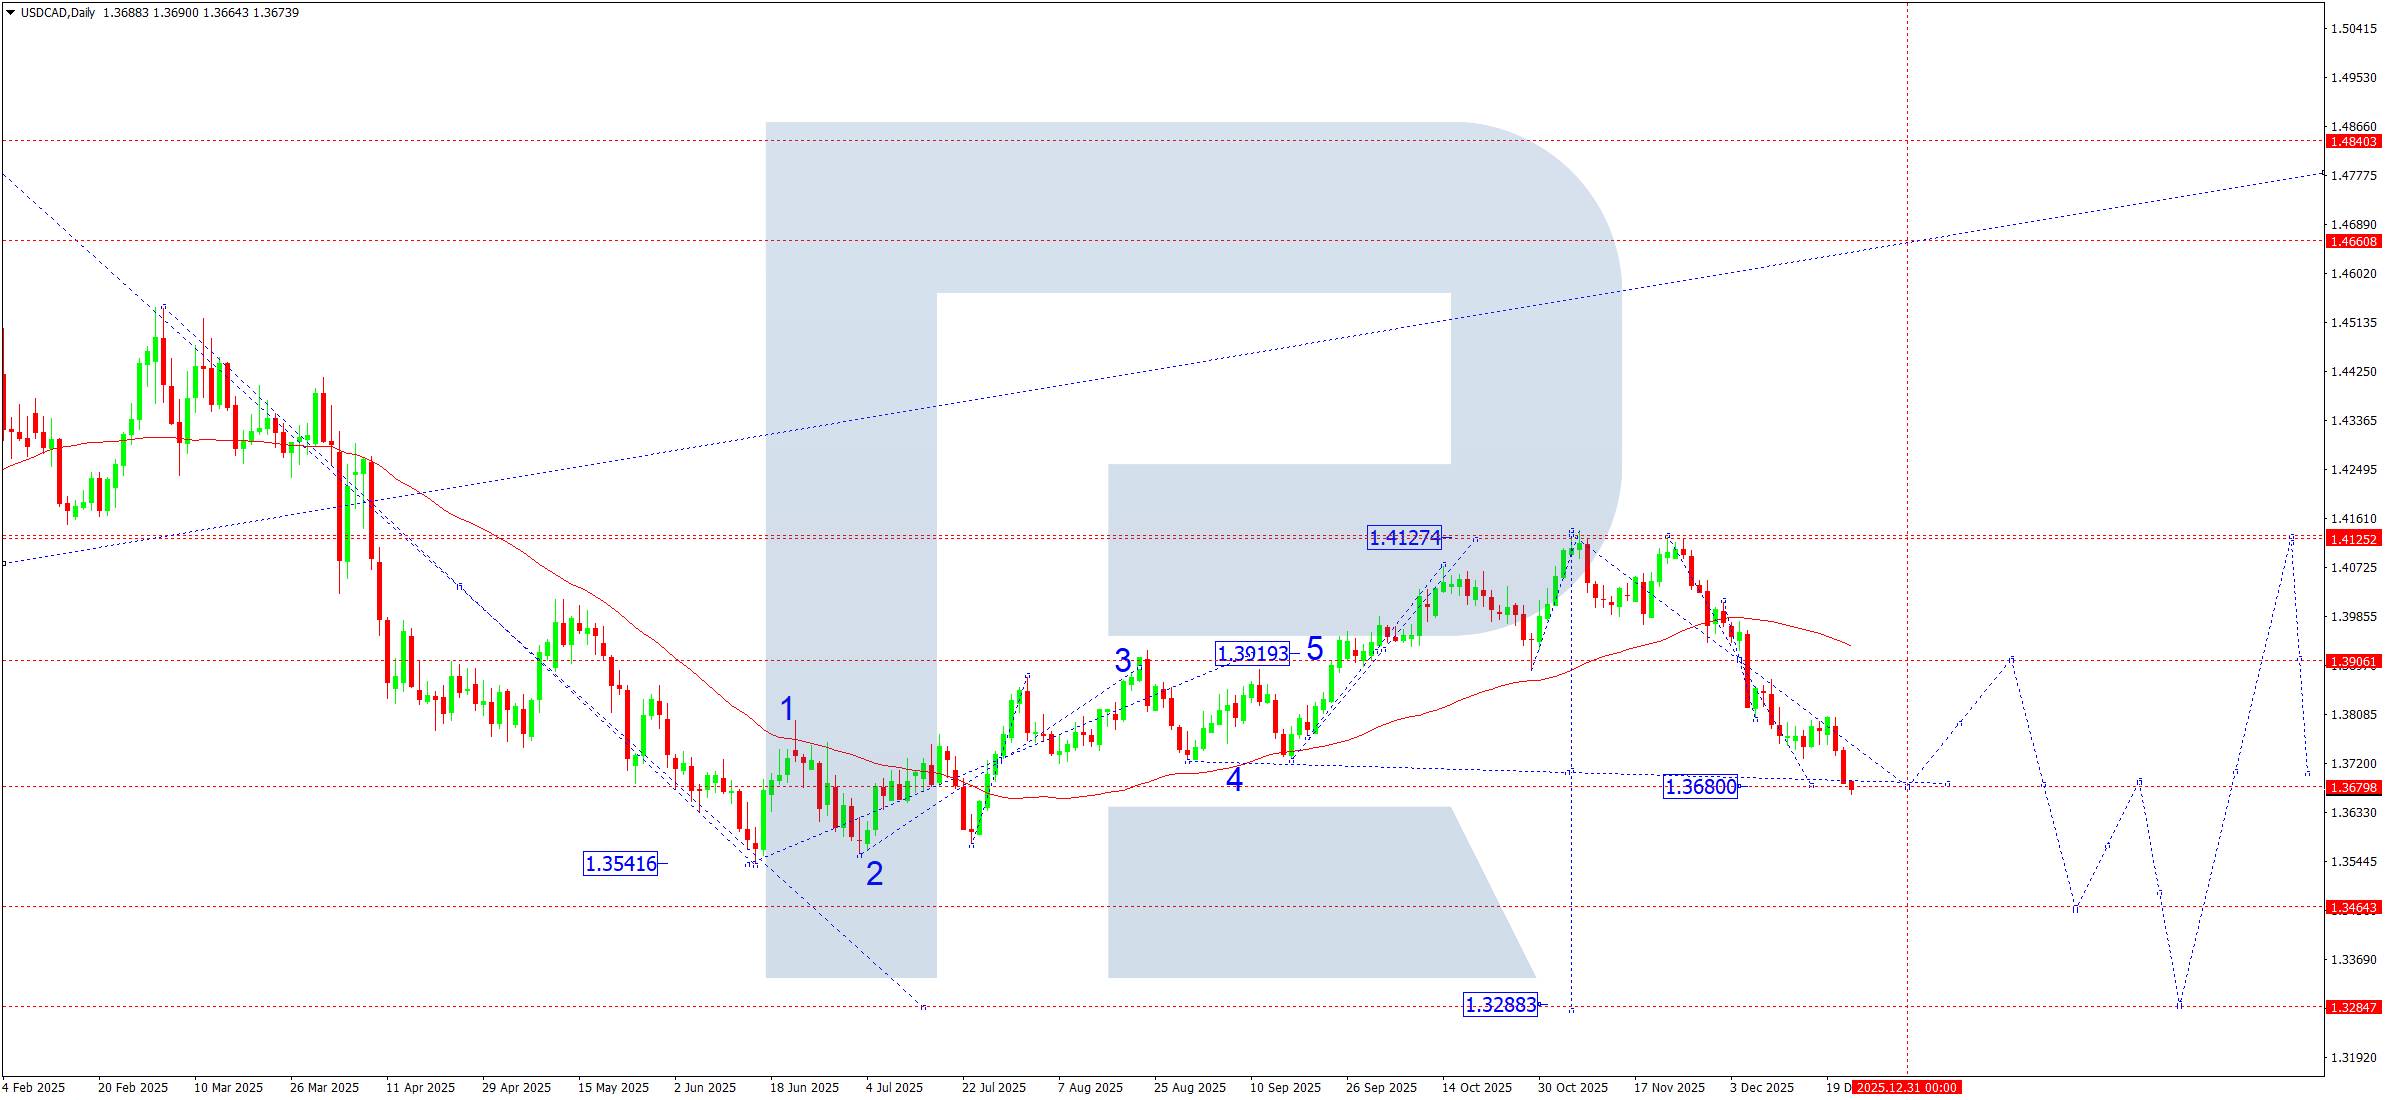
On the daily chart, USDCAD formed a consolidation range around 1.3906. A downside breakout led to an almost complete fulfilment of the downward wave's potential, with the target area at 1.3680.
Over the coming week, it remains relevant to consider the formation of a new consolidation range above 1.3680. If the market breaks out upwards from the range, it may develop a corrective leg within the current downward wave.
The correction target is 1.3900.
If the market breaks downwards from the range, it will open potential to continue the downward wave to 1.3464, which acts as the local target of the move.
USDCAD forecast scenarios
Bullish scenario (main): it will be relevant to consider the probability of corrective growth starting towards 1.3900.
Bearish scenario (alternative): holding below 1.3680 effectively opens the way to consider the probability of the downtrend continuing, with the prospect of a decline to 1.3288.
XAUUSD forecast
Gold continues to receive support amid ongoing geopolitical tension and higher demand for safe-haven assets. In low-liquidity year-end conditions, the market becomes more sensitive to impulsive moves and technical levels, which increases the probability of the current growth wave continuing.
XAUUSD technical analysis
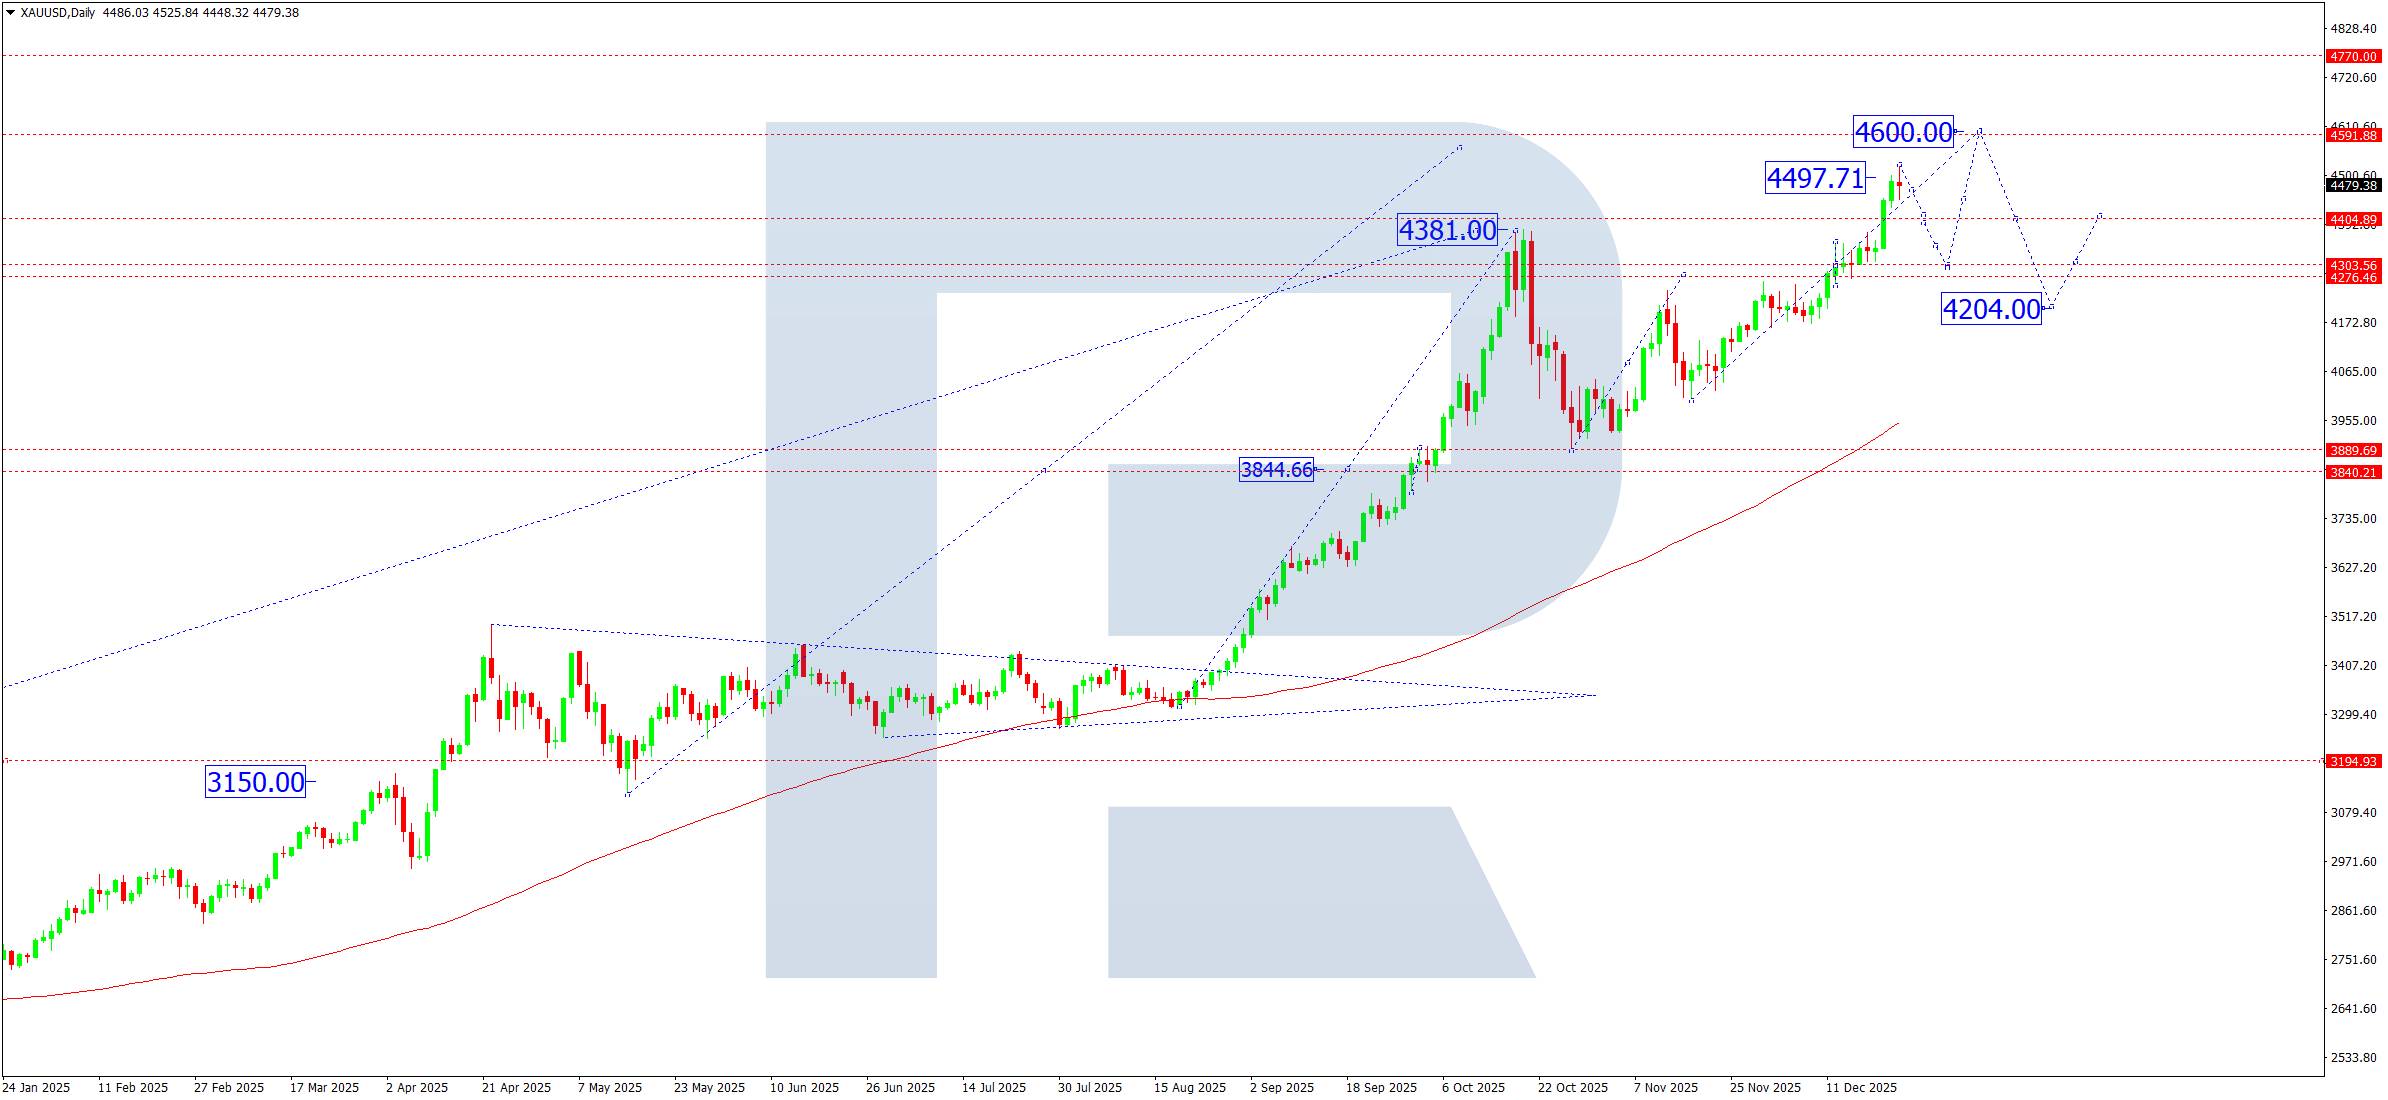
On the daily chart, the market formed a consolidation range around 4,300. Last week, an upside breakout from this range confirmed the continuation of the upwards wave structure. As a result, the market extended the growth wave and reached 4,525.
It is relevant to note that the current wave extension may continue without forming a deep correction, with a potential target near 4,600. After reaching this target level, the market may develop a corrective move with a return to the key support zone at 4,300.
XAUUSD forecast scenarios
Bullish (main): holding support at 4,300 keeps the upwards impulse valid and opens potential to continue meeting the growth wave, with the target at 4,600.
Bearish (alternative): firm consolidation below 4,400 will signal a weakening of the upwards structure and open potential for a corrective decline to 4,200.
Brent forecast
Over the coming week, the oil market remains in a zone of high sensitivity to geopolitical factors. Risks of escalation in Europe and the Middle East remain, while tensions around Venezuela are also rising, which may affect global supply chains. Limited liquidity during the New Year holidays provides additional support for prices, as it increases the likelihood of impulsive moves without a deep correction. Overall, the fundamental backdrop remains moderately bullish, with a risk of sharp accelerations upwards.
Brent technical analysis
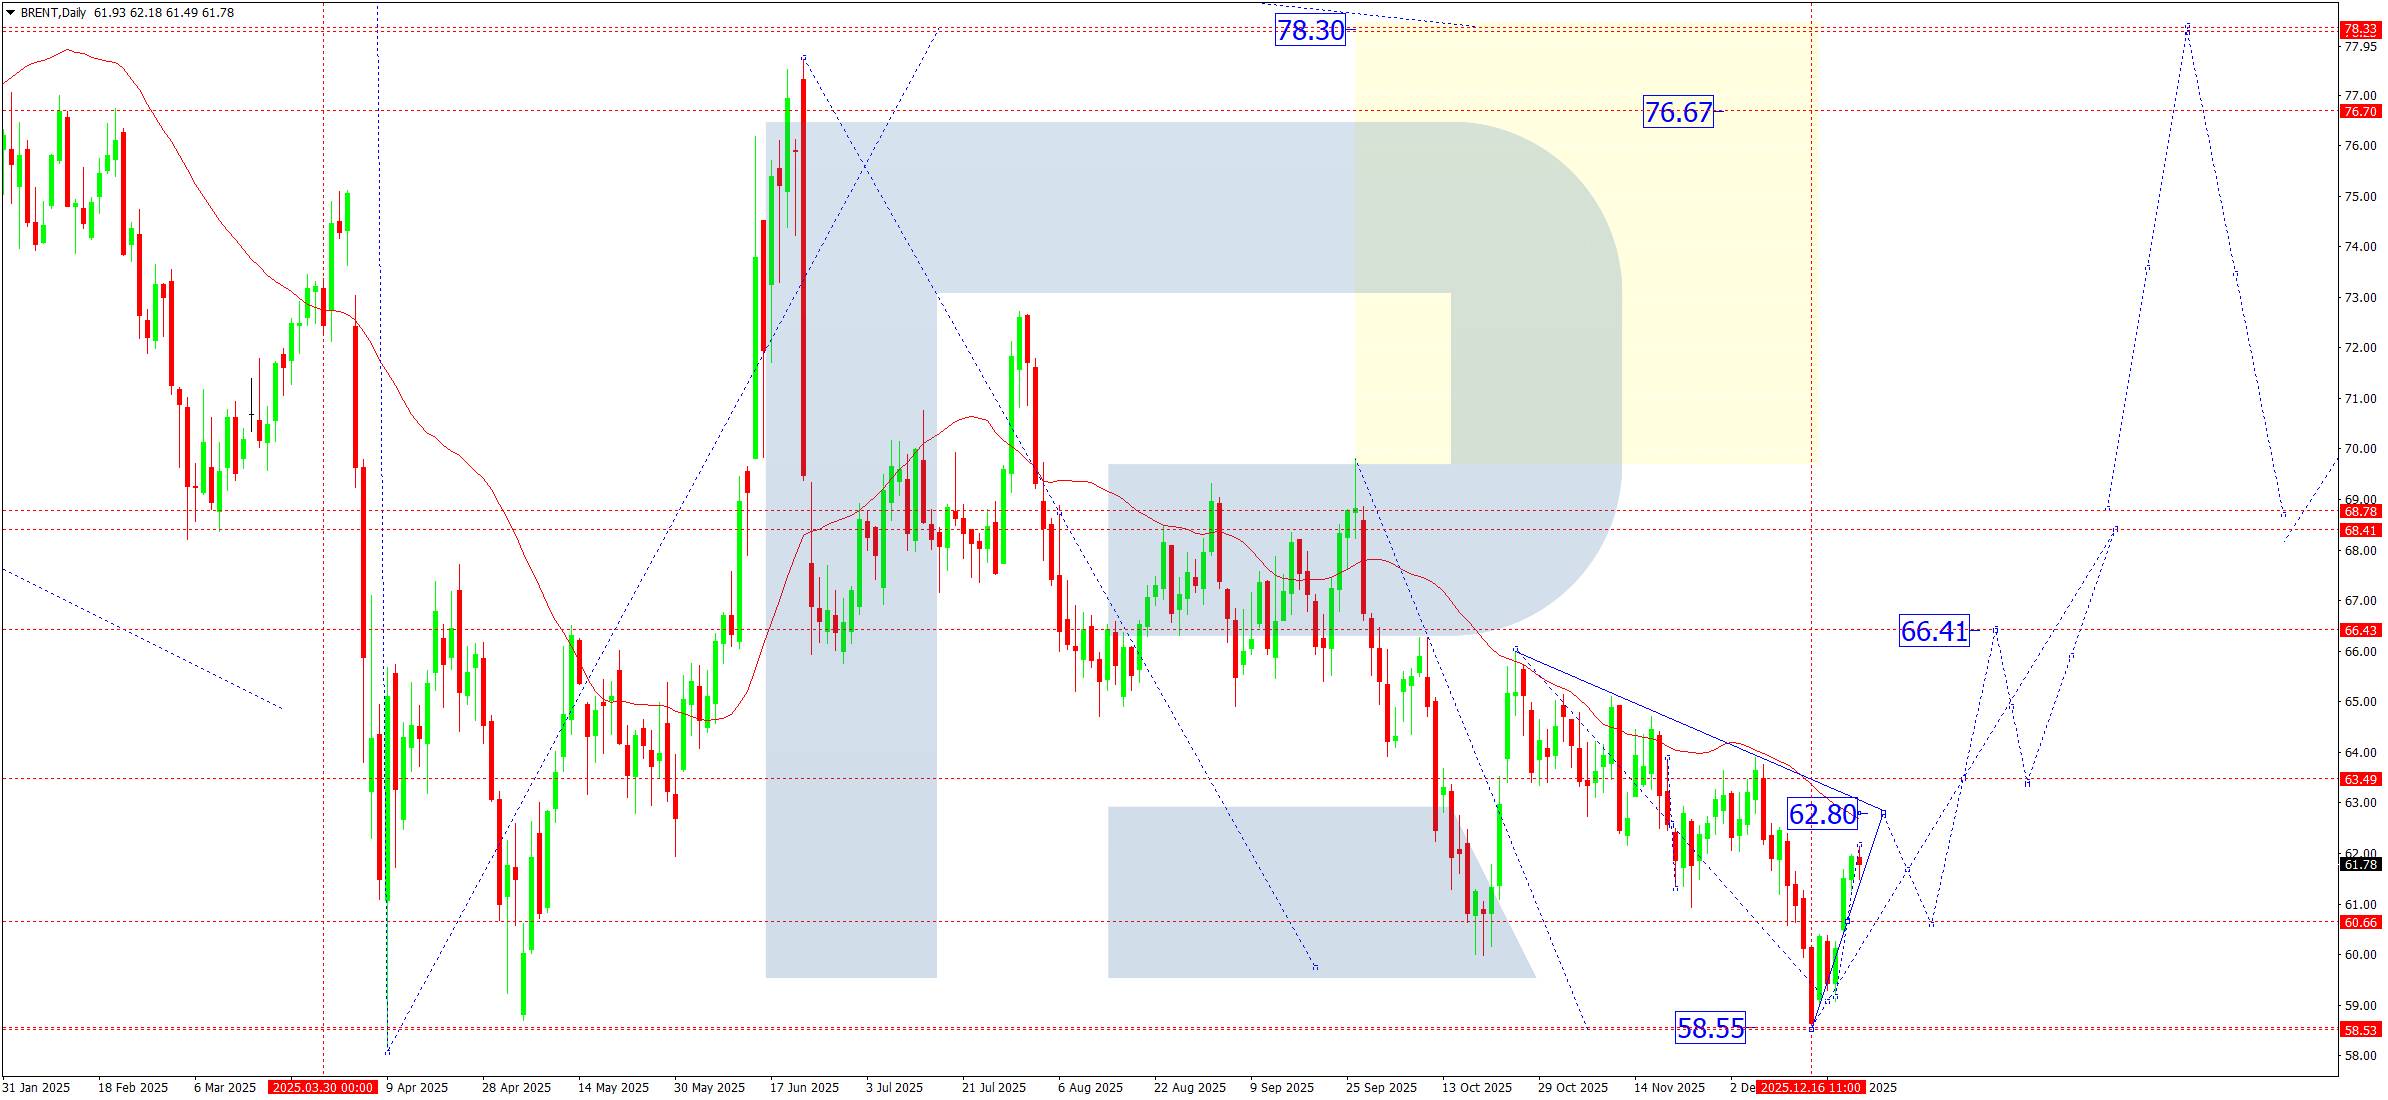
On the daily chart, Brent crude forms a growth wave structure with a target guide near 62.80. Last week, the market met the local target of this wave at 62.18, after which it entered a slowdown phase.
This week, the market may develop a corrective leg with a potential decline to 60.66 (a test from above of the previously broken zone). The market will treat this scenario as a technical correction within the current upwards structure. After it ends, we expect growth to resume and the market to form the next impulse towards 62.80.
Brent forecast scenarios
Bullish scenario (main): given the persistent and potentially escalating geopolitical risks, the market may continue rising without forming a deep correction. In this case, it will be relevant to consider accelerated movement to the following targets:
#.first target - 62.80
#.second target - 66.40
#.main target of the first growth wave - 68.40
Bearish scenario (alternative): the market develops a corrective move with a decline to 60.66. A deeper correction below 59.50 will cast doubt on the current growth wave structure and will require a review of scenarios.
 EURUSD 2026-2027 forecast: key market trends and future predictions
This article provides the EURUSD forecast for 2026 and 2027 and highlights the main factors determining the direction of the pair's movements. We will apply technical analysis, take into account the opinions of leading experts, large banks, and financial institutions, and study AI-based forecasts. This comprehensive insight into EURUSD predictions should help investors and traders make informed decisions.
 Gold (XAUUSD) forecast 2026 and beyond: expert insights, price predictions, and analysis
Dive deep into the Gold (XAUUSD) price outlook for 2026 and beyond, combining technical analysis, expert forecasts, and key macroeconomic factors. It explains the drivers behind gold's recent surge, explores potential scenarios including a move toward 4,500 to 5,000 USD per ounce, and highlights why the metal remains a strong hedge during global uncertainty.


