Market Overview
Crude oil prices slipped toward $60 per barrel, weighed by persistent uncertainty over global supply chains amid renewed geopolitical tensions. While progress in trade discussions has supported sentiment around global growth, the lack of clarity on future energy cooperation leaves markets uneasy.
Traders are also eyeing the upcoming OPEC+ meeting on November 2, where officials may consider a limited production boost for December.
Oil remains on track for a third straight monthly decline — its longest losing streak since mid-2023 — as fears of oversupply and weakening demand outlook continue to suppress both oil and natural gas market momentum.
Natural Gas Price Forecast
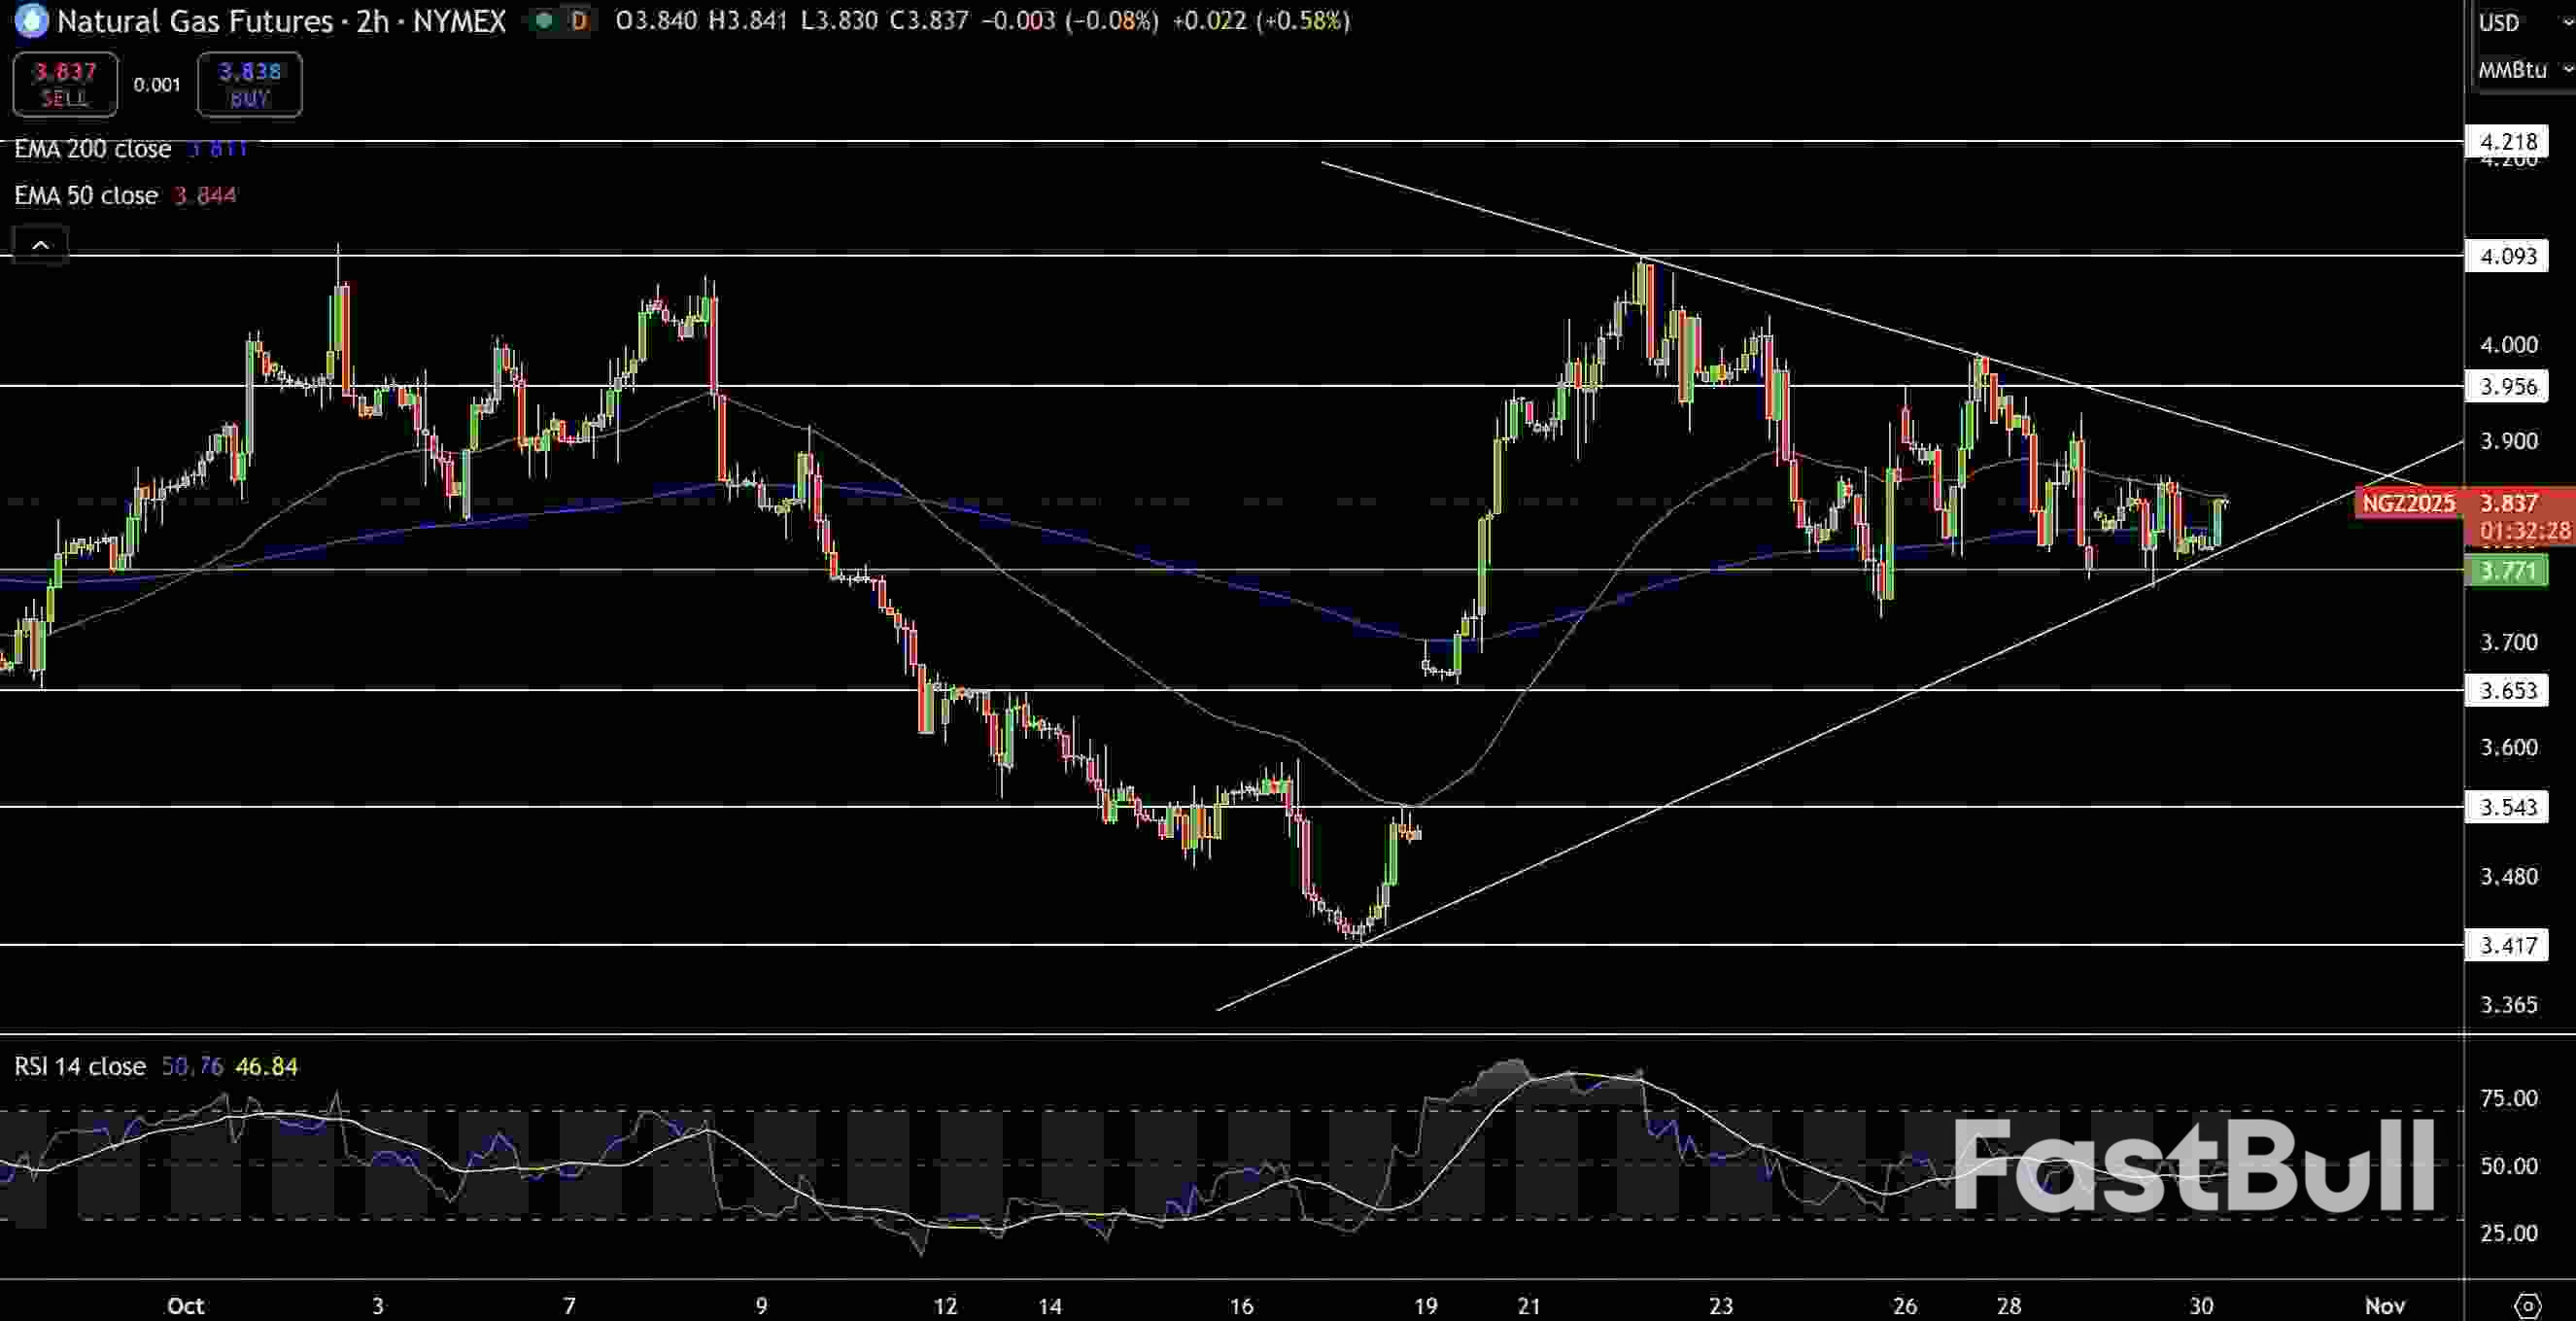
 Natural Gas (NG) Price Chart
Natural gas prices are trading near $3.84, forming a symmetrical triangle pattern that suggests a potential breakout soon. The price is consolidating between resistance at $3.95 and support around $3.77, with both 50- and 200-period EMAs converging near the current level — showing a neutral short-term bias. RSI hovers around 50, confirming a lack of momentum on either side.
A break above $3.95 could expose $4.09 and $4.21, while a drop below $3.77 may invite selling pressure toward $3.65 and $3.54.
Traders are watching for volume confirmation to validate the next move as the market approaches the triangle’s apex, signaling reduced volatility before a possible sharp price swing.
WTI Oil Price Forecast
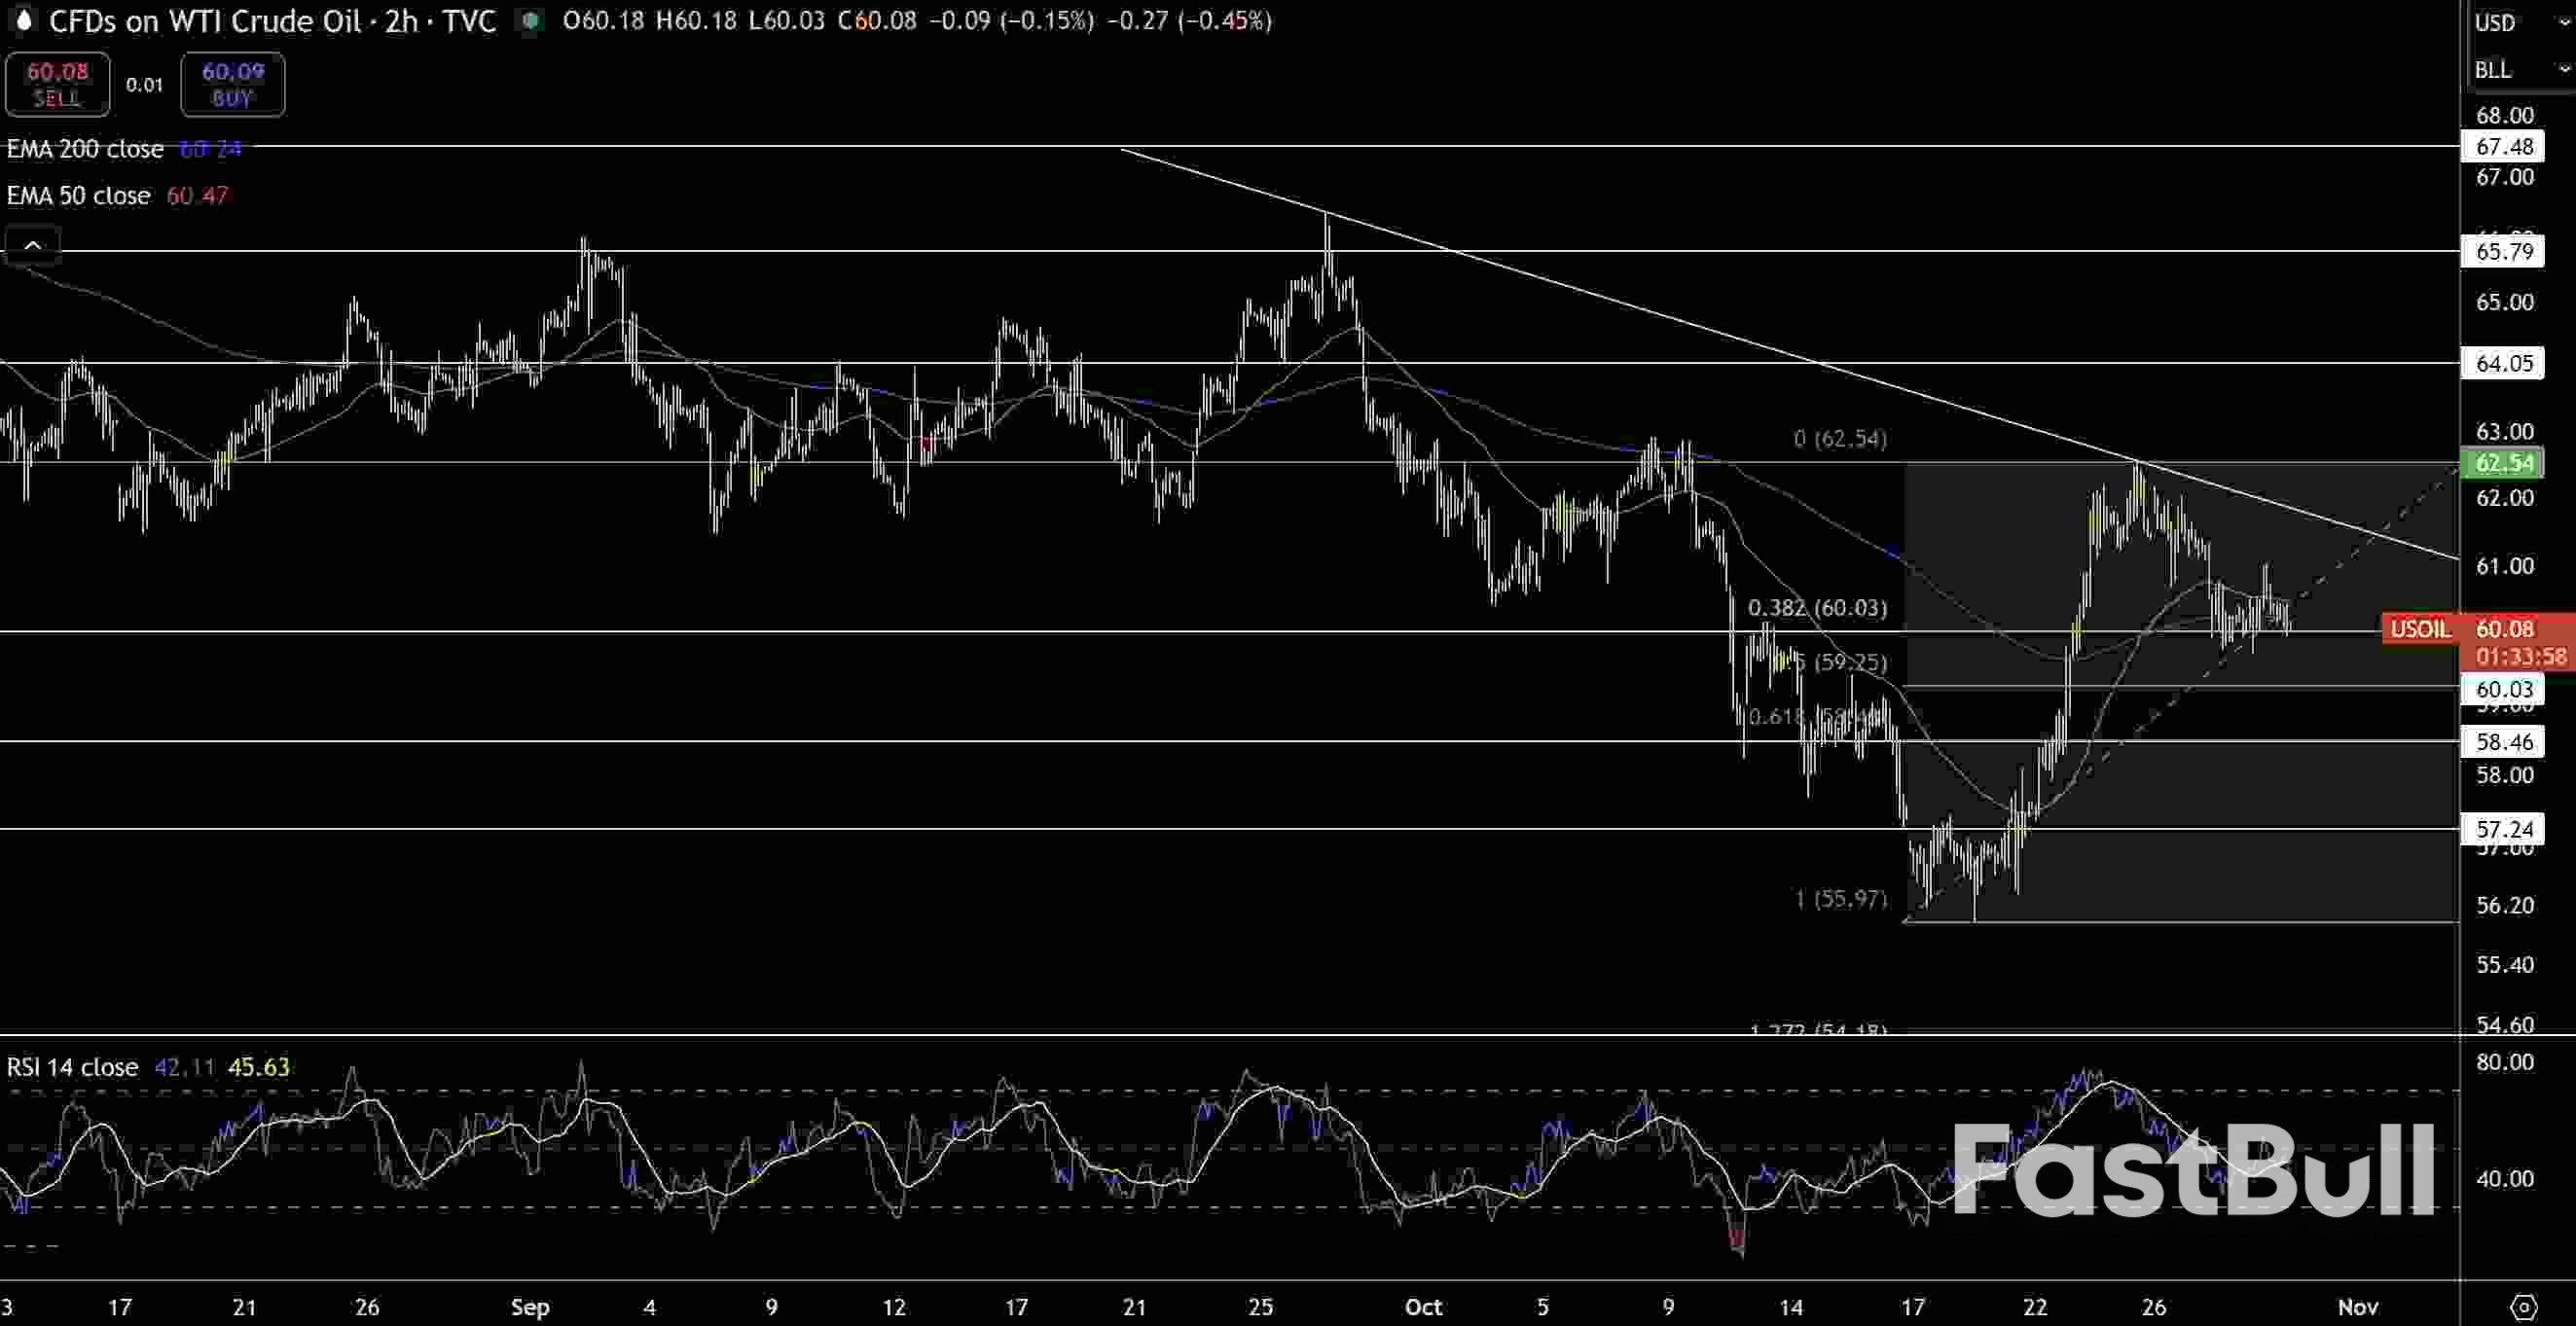
 WTI Price Chart
WTI Crude Oil is trading around $60.08, consolidating just above the key 38.2% Fibonacci retracement level at $60.03. The price remains trapped below a descending trendline drawn from September highs, which continues to cap upside momentum near $62.50. Both the 50-EMA ($60.47) and 200-EMA ($60.24) are converging, signaling a period of equilibrium before the next directional move.
The RSI at 42 suggests mild bearish pressure but not yet oversold conditions. A sustained break below $59.25 could expose $58.46 and $57.20, while a rebound above $61.20 would strengthen the bullish case toward $62.50.
Brent Oil Price Forecast
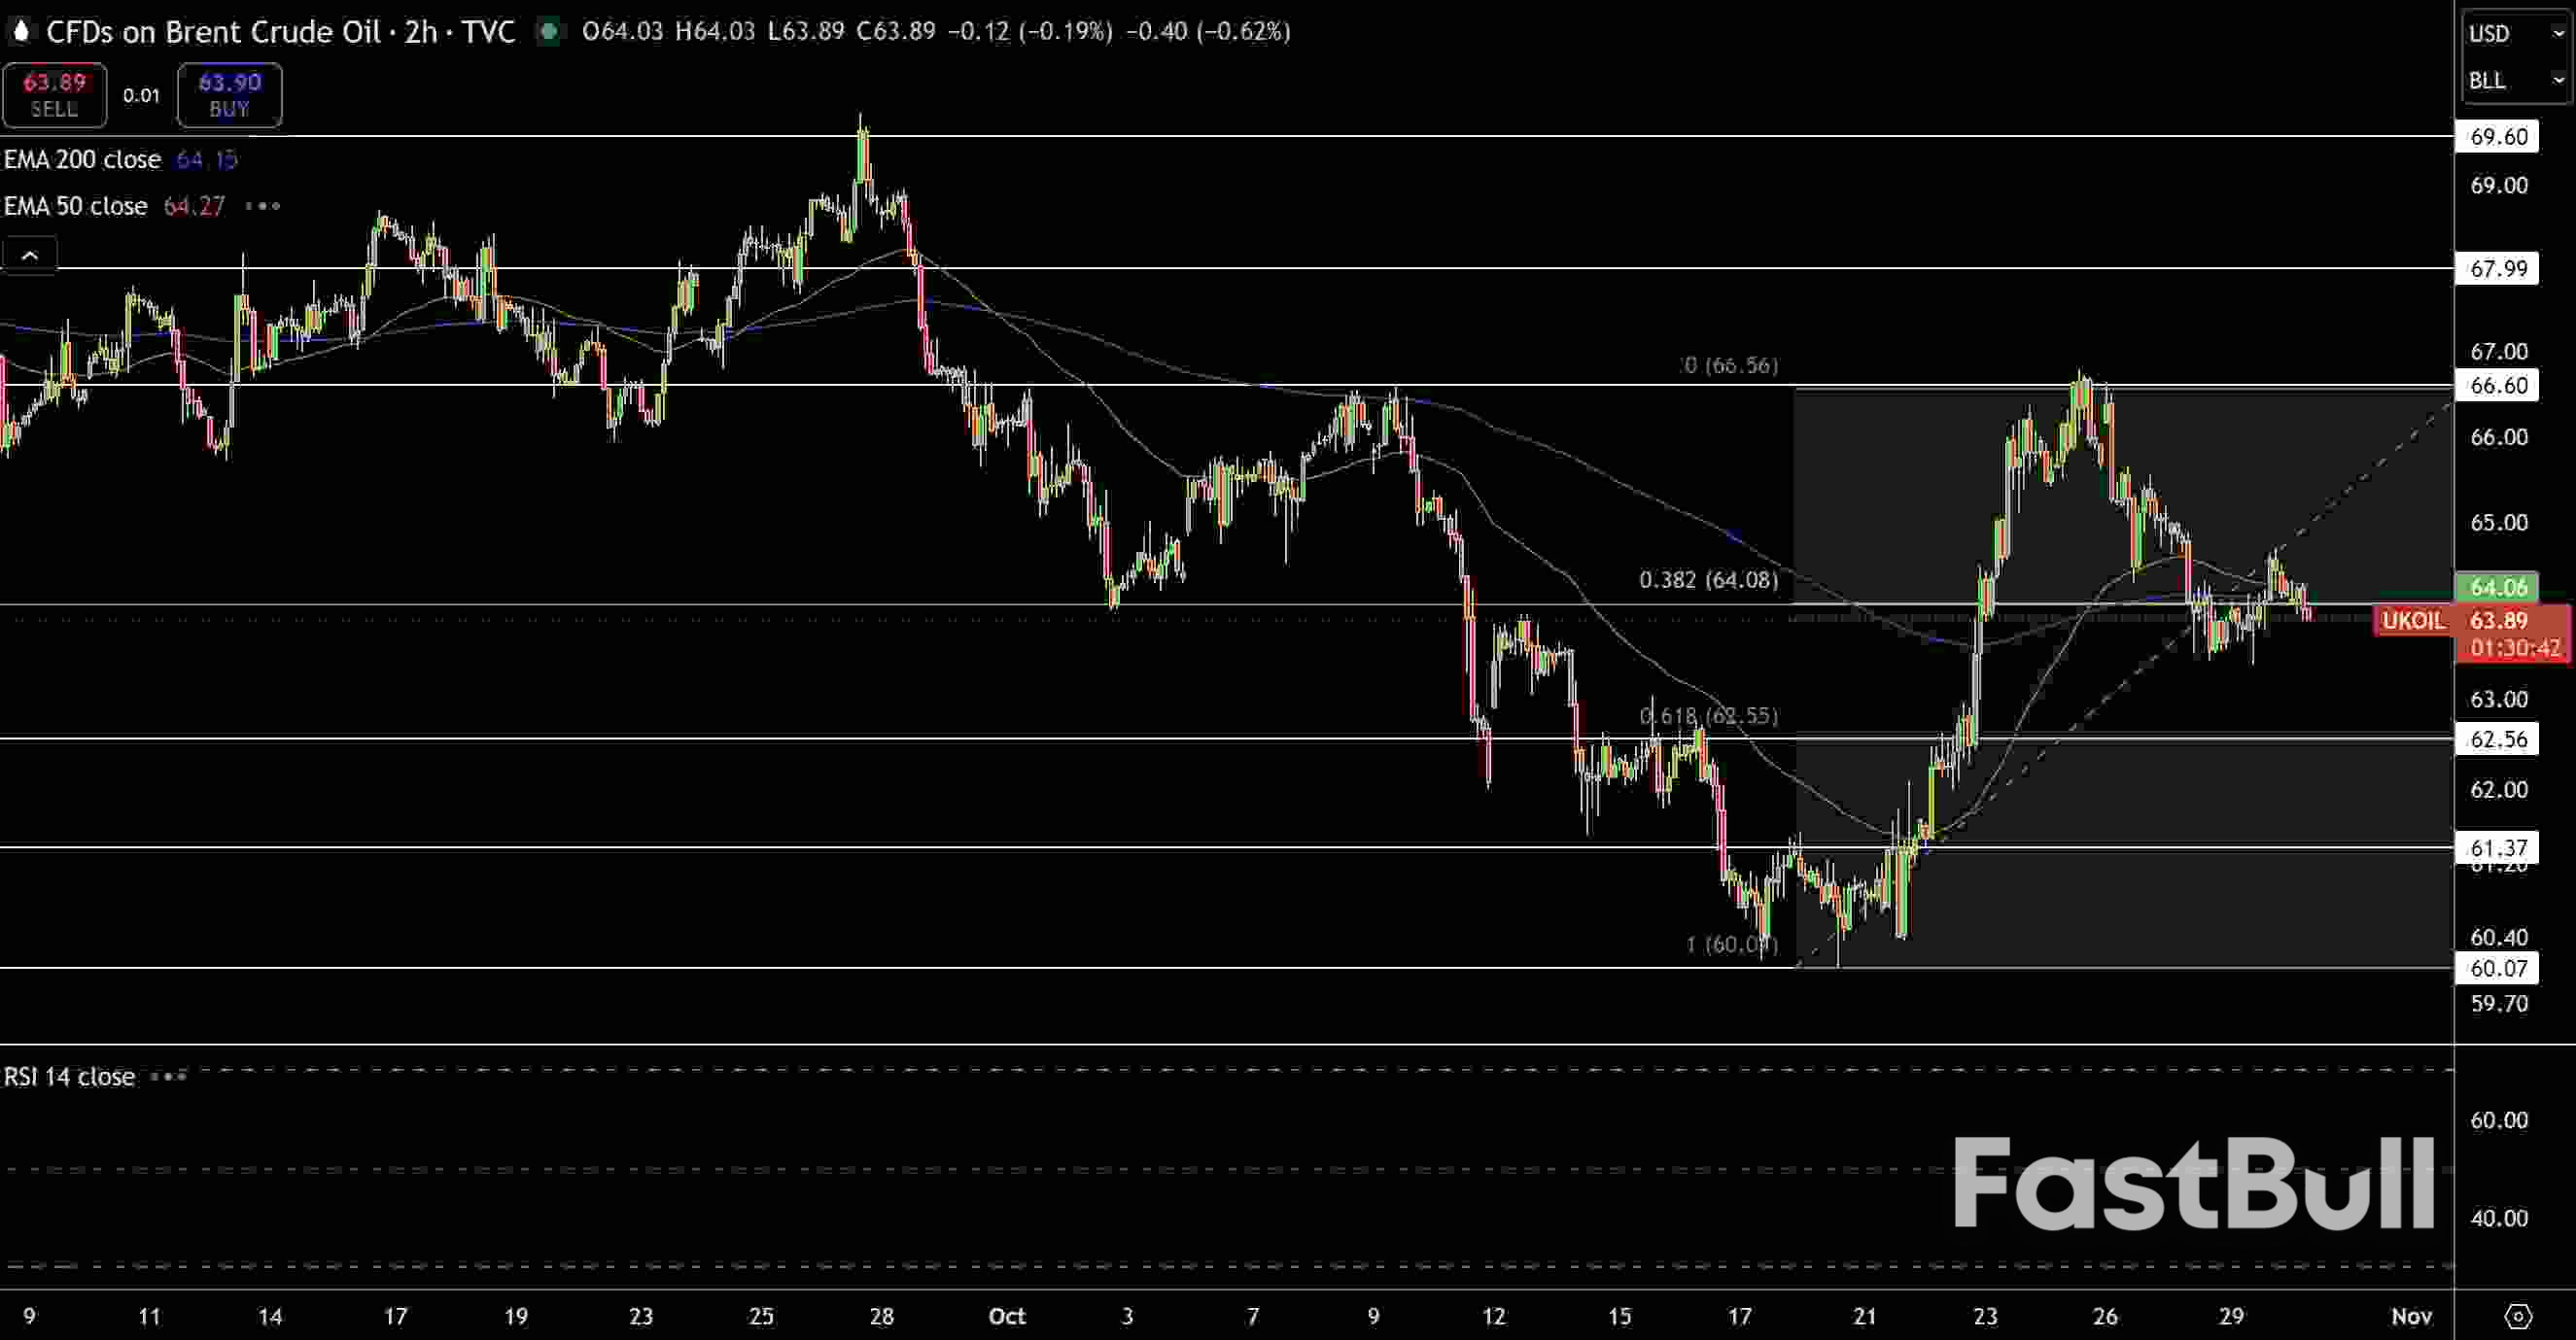
 Brent Price Chart
Brent crude oil faces mild pressure around $63.89, hovering below both the 50- and 200-period EMAs near $64.15–$64.27, signaling a fragile short-term bias. The Fibonacci retracement shows key resistance at $64.08 (38.2%) while support stands at $62.55 (61.8%).
A clear break below $63.80 could open the door toward $62.50 and $61.37, whereas reclaiming $64.30 might encourage a retest of $65.50–$66.00. RSI remains neutral, reflecting indecision among traders after the recent pullback from $66.50 highs.
Overall, Brent’s near-term direction depends on whether buyers can defend the $63.80 pivot to maintain the recovery structure.
Source: fxempire
Copyright © 2025 FastBull Ltd
News, historical chart data, and fundamental company data are provided by FastBull Ltd.
Risk Warnings and Disclaimers
You understand and acknowledge that there is a high degree of risk involved in trading. Following any strategies or investment methods may lead to potential losses. The content on the site is provided by our contributors and analysts for information purposes only. You are solely responsible for determining whether any trading assets, securities, strategy, or any other product is suitable for investing based on your own investment objectives and financial situation.


 Natural Gas (NG) Price Chart
 WTI Price Chart
 Brent Price Chart


