Natural Gas And Oil Forecast: Is Oil Stabilizing At $61 Or Slipping Toward $60 Next?
 Winkelmann
Oil and gas prices slide as easing geopolitical risk and steady OPEC+ supply push WTI toward $60, while natural gas consolidates near $3.20 support.
Key Points:

Market Overview
Oil and natural gas prices are falling as geopolitical tensions ease, removing recent risk premiums and shifting focus back to strong supply. WTI crude is now around $61 to $62 per barrel, down from late January highs of $65 to $66, after dropping nearly 5% in one day earlier this week.
A stronger US dollar is adding pressure, and OPEC+ has confirmed it will keep output steady, supporting the view that global supply will remain high. With demand growth expected to stay below 1 million barrels per day in 2026 and inventories likely to rise, prices are now testing important support near $60.
Volatility is still high, but the market has clearly moved from risk-driven rallies to a more cautious, balanced approach.
Natural Gas Forecast: $3.20 Holds as Price Pulls Back Within Rising Channel
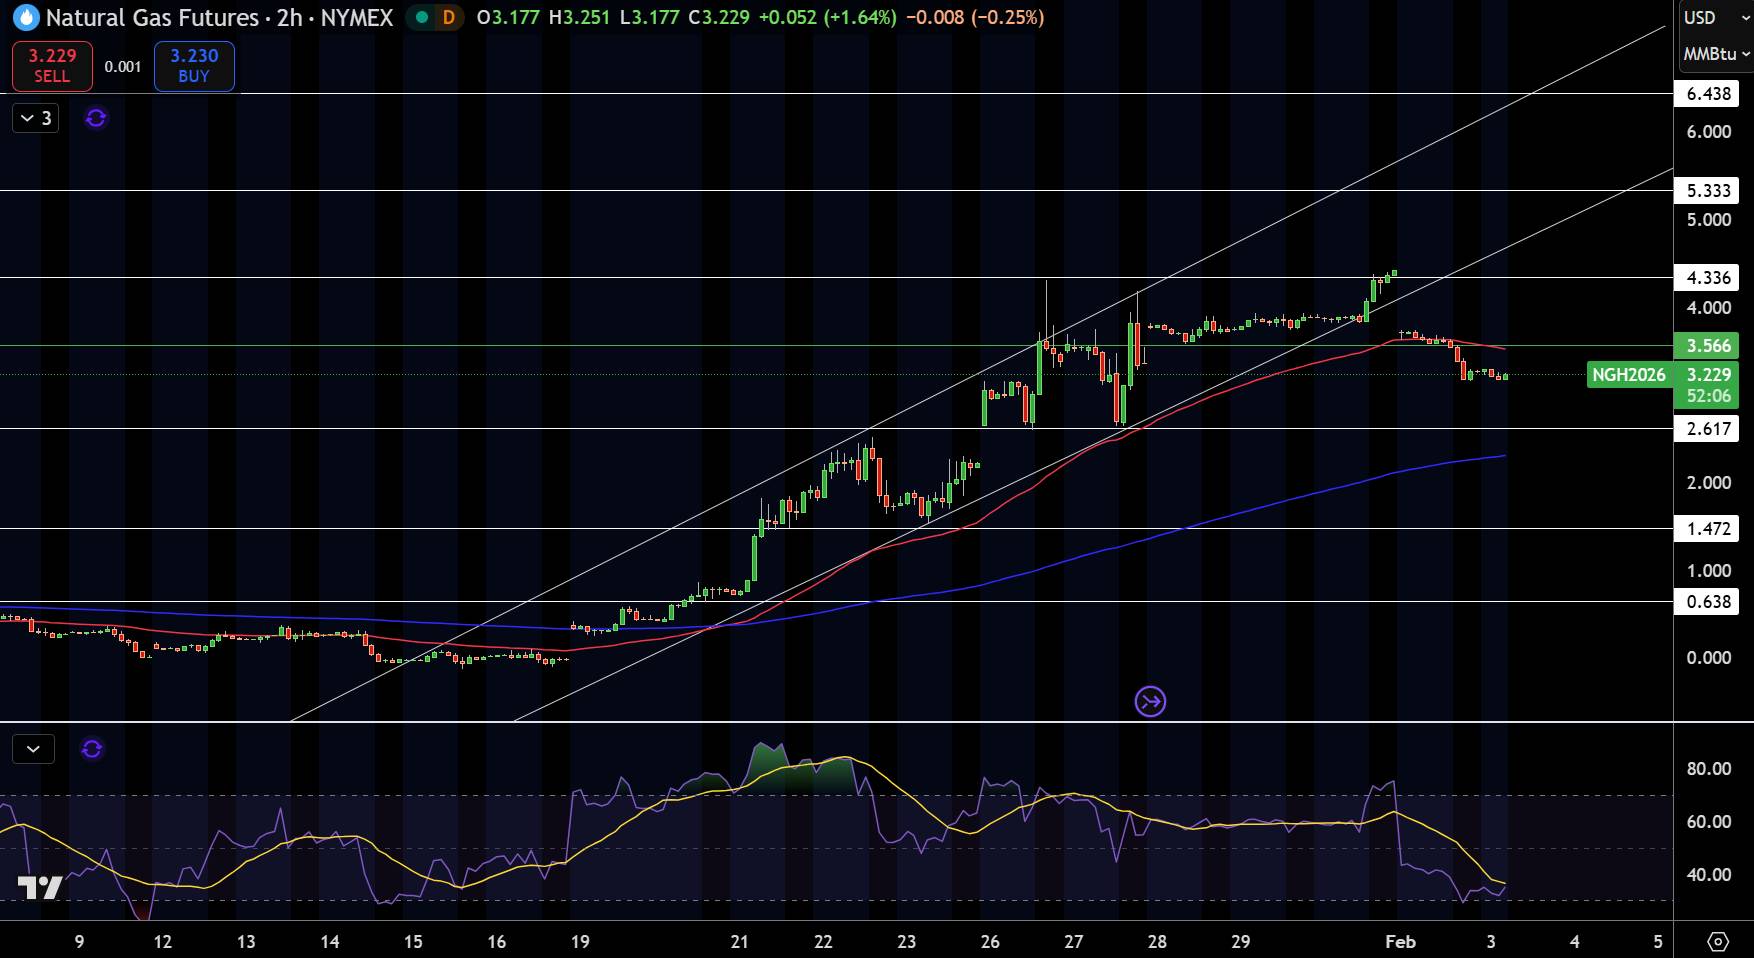 Natural Gas (NG) Price Chart
Natural gas is trading near $3.23, easing after failing to hold above the recent swing high near $3.55. On the 2-hour chart, price remains inside a rising channel, but recent candles show smaller bodies and lower highs, pointing to short-term consolidation. The pullback has brought price back toward the 50-EMA, which is flattening and acting as near-term support.
The broader trend stays constructive as long as price holds above $3.10–$3.15, a zone aligned with prior resistance turned support. The 200-EMA near $2.60 continues to slope higher, reinforcing the medium-term uptrend. The RSI around 40–45 shows cooling momentum, not aggressive selling.
Trade idea: Buy dips near $3.15, targeting $3.55, invalidated below $3.00.
WTI Crude Oil Forecast: $61.80 Holds After Channel Breakdown—What's Next?
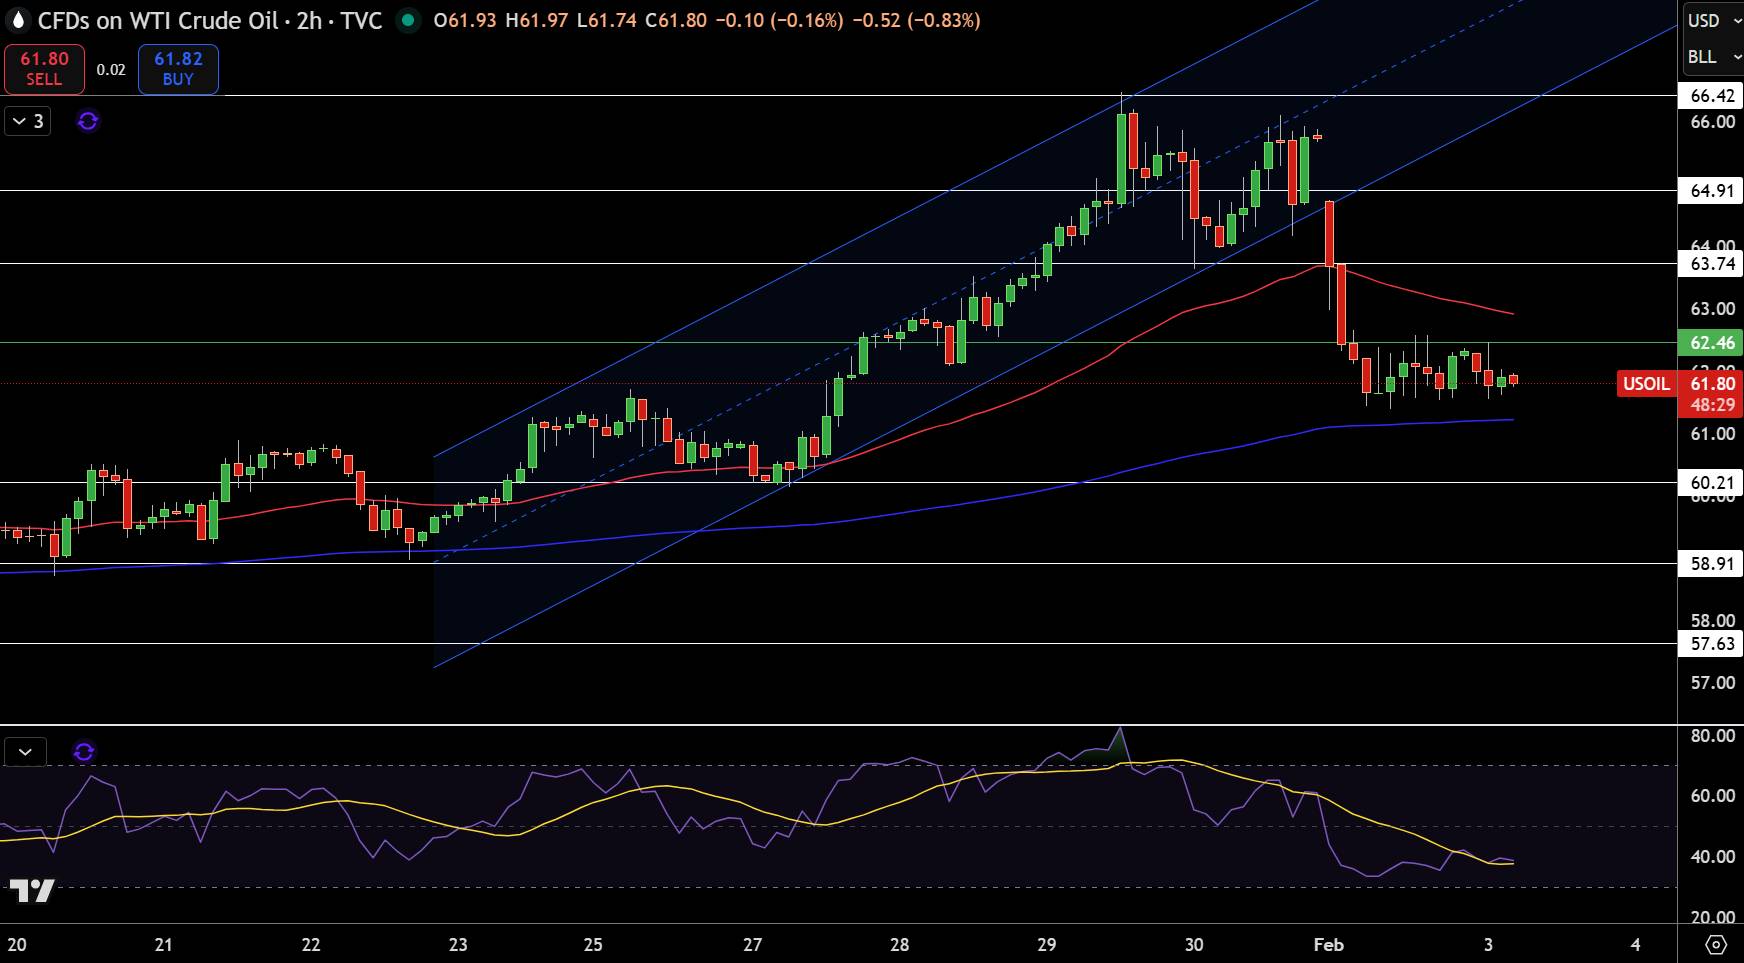 WTI Price Chart
WTI crude oil is trading near $61.80, consolidating after a sharp rejection from the upper boundary of a rising channel. On the 2-hour chart, a strong bearish engulfing candle marked the breakdown below the channel midline, signaling a shift from momentum buying to profit-taking. Price is now below the 50-EMA, while the 200-EMA near $61.00 is acting as near-term support.
Former resistance around $63.70–$64.00 has turned into a supply zone. The RSI near 40 shows weak momentum, suggesting sellers still control the pace but without panic selling. A clean break below $61.00 could open room toward $60.20, while recovery needs a move back above $62.50.
Trade idea: Sell rallies near $62.50, targeting $60.20, invalidated above $63.80.
Brent Crude Forecast: $66 Holds as Bulls Lose Control Below Rising Channel
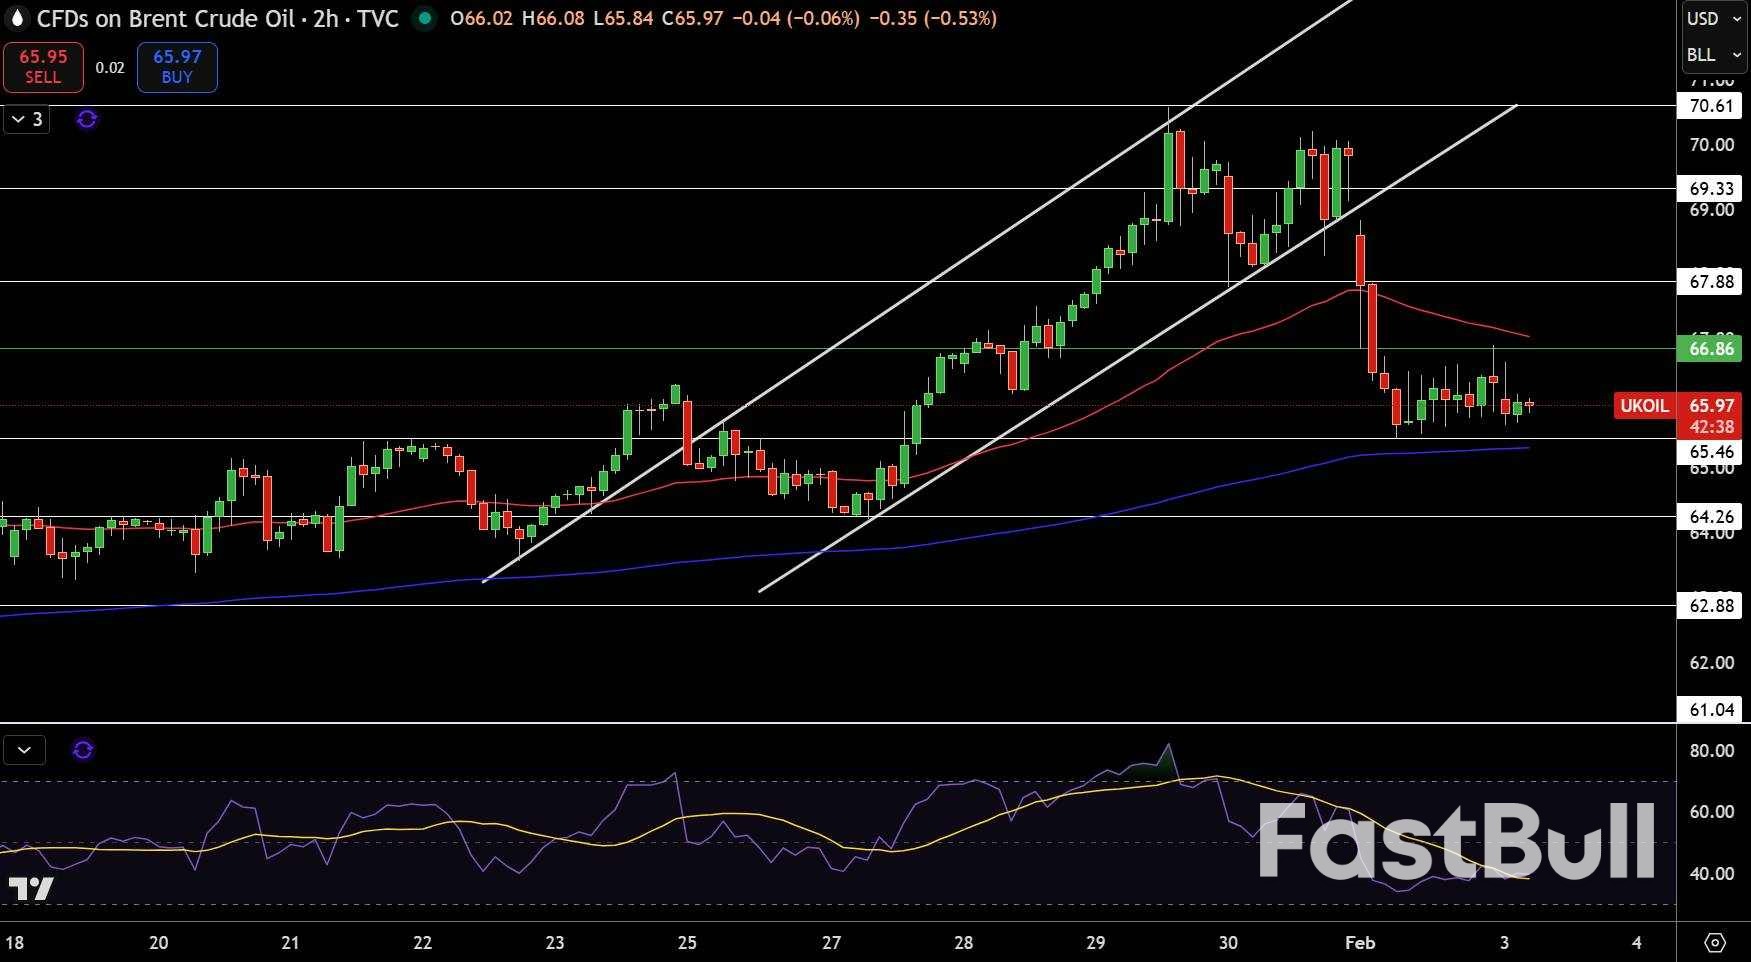 Brent Price Chart
Brent crude is trading near $66.00, moving sideways after a sharp rejection from the top of a rising channel. On the 2-hour chart, a strong bearish candle broke price below the channel support and the 50-EMA, signaling a loss of upside momentum. Since then, candles have been smaller, showing consolidation rather than a quick rebound.
The area around $66.80–$67.00 now acts as resistance, while the 200-EMA near $65.50 is providing short-term support. A break below $65.40 could open the door toward $64.25, a prior demand zone. The RSI near 40 reflects weak momentum, suggesting sellers remain in control without extreme pressure.
Trade idea: Sell rebounds near $66.80, targeting $64.30, invalidated above $67.90.


