The US stock market retreated for a second straight session on Thursday, 30 October 2025, led by the Nasdaq 100’s 1.5% drop after Meta’s sharp selloff (-11.3%) on rising AI-related capex.
In addition, Fed Chair Powell’s pushback against expectations of another near-term rate cut during his post-FOMC press conference drove the U.S. dollar to a three-month high and lifted longer-term US Treasury yields. The 10-year US Treasury jumped by 10 basis points (bps) from Tuesday, 28 October (before this week’s FOMC meeting) to 4.1% on Friday, 31 October at the time of writing
Despite the dip, major indices held key support levels, while US futures rebounded in after-hours trading and in today’s Asia session on strong Apple and Amazon Q3 earnings and guidance.
We will examine a key macro intermarket relationship and highlight several positive technical factors that reinforce the Nasdaq 100’s ongoing short-term uptrend.
The implied volatility of US Treasury yields remained compressed
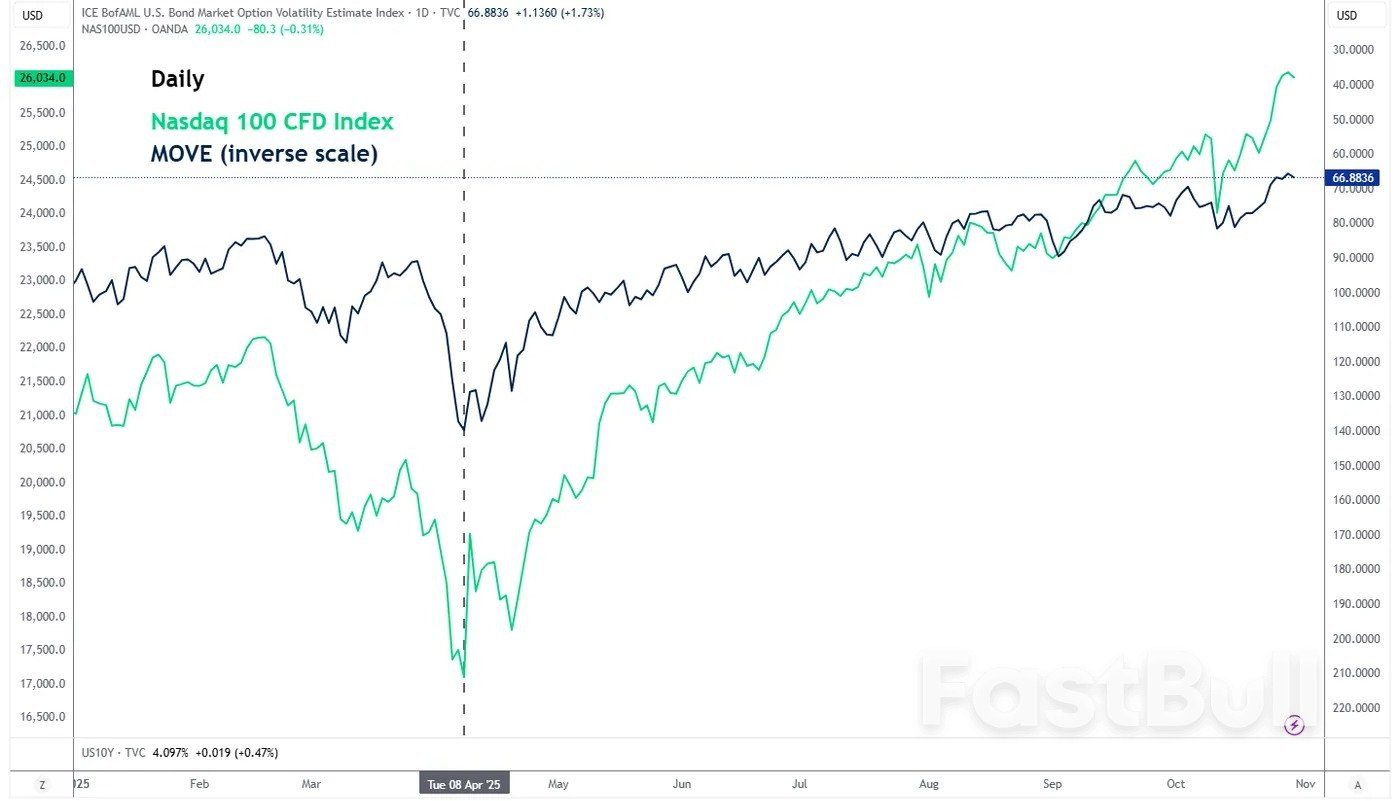
 Fig. 1: MOVE Index & US Nasdaq 100 CFD Index medium-term trends as of 30 Oct 2025
The “Merrill Lynch Option Volatility Estimate”, the MOVE Index in short form, tracks the volatility of US Treasury yields implied by current prices of one-month OTC options.
Since the aftermath of the U.S. “Liberation Day” reciprocal tariffs on 8 April 2025, the inverse of the MOVE Index has tracked the Nasdaq 100 in near lockstep, highlighting how declining bond market volatility has supported risk-on sentiment and reinforced short-term equity momentum.
Therefore, it is the volatility of U.S. Treasury yields, rather than the absolute changes in their levels, that drives the dynamics of the US stock indices (see Fig. 1).
Interestingly, the MOVE Index closed at a lower level of 66.88 on Thursday, 30 October, down from 68.94 the previous Thursday, 23 October (inverse scale shown in Fig. 1).
Let’s now break down the latest technical analysis elements, short-term trajectory (1 to 3 days), and relevant short-term key levels to watch for the US Nasdaq 100 CFD Index (a proxy of the Nasdaq 100 futures).
Preferred trend bias (1-3 days) – Oscillating within a minor ascending channel
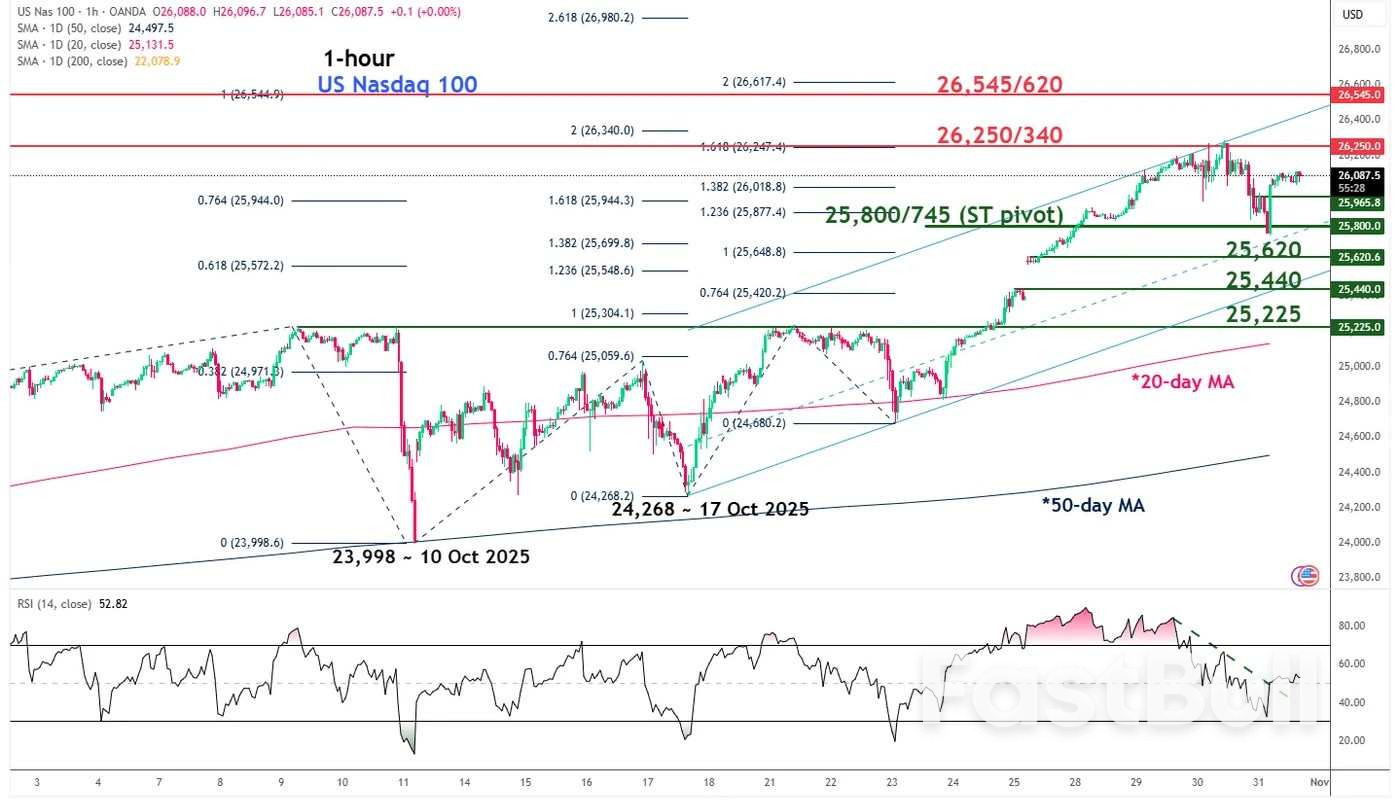
 Fig. 2: US Nasdaq 100 CFD Index minor trend as of 31 Oct 2025
Watch the 25,800/25,745 key short-term pivotal support on the US Nasdaq 100 CFD Index to maintain its current minor/short-term uptrend phase in place since 10 October 2025 (see Fig. 2).
A clearance above the 26,340 near-term resistance sees the next resistance coming in at 26,545/26,620 (ascending channel top and Fibonacci extension cluster).
Key elements
The 25,800/25,745 key short-term support confluences with the 23.6% Fibonacci retracement of the current impulsive up move sequence from 17 October 2025 low to 30 October 2025 current all-time high.
The hourly RSI momentum indicator has staged a bullish breakout from its prior descending resistance and surpassed the 50 level. These observations suggest a potential resurgence of short-term bullish momentum for the US Nasdaq 100 CFD Index.
Alternative trend bias (1 to 3 days)
A break below the 25,745 key short-term support on the US Nasdaq 100 CFD Index negates the bullish tone for an extension of the minor corrective decline sequence to expose the next intermediate supports at 25,620 and 25,440 (minor ascending channel bottom and a gap up formed on Monday, 27 October 2025).
Source: marketpulse


 Fig. 1: MOVE Index & US Nasdaq 100 CFD Index medium-term trends as of 30 Oct 2025
 Fig. 2: US Nasdaq 100 CFD Index minor trend as of 31 Oct 2025


