بيتكوين أسبوع جديد مع سوق صاعدة على المحك مع تباين توقعات سعر بيتكوين بشكل كبير.
يعلق تجار البيتكوين بين الأمل والاستسلام حيث يعود زوج BTC/USD إلى مستواه الافتتاحي السنوي.
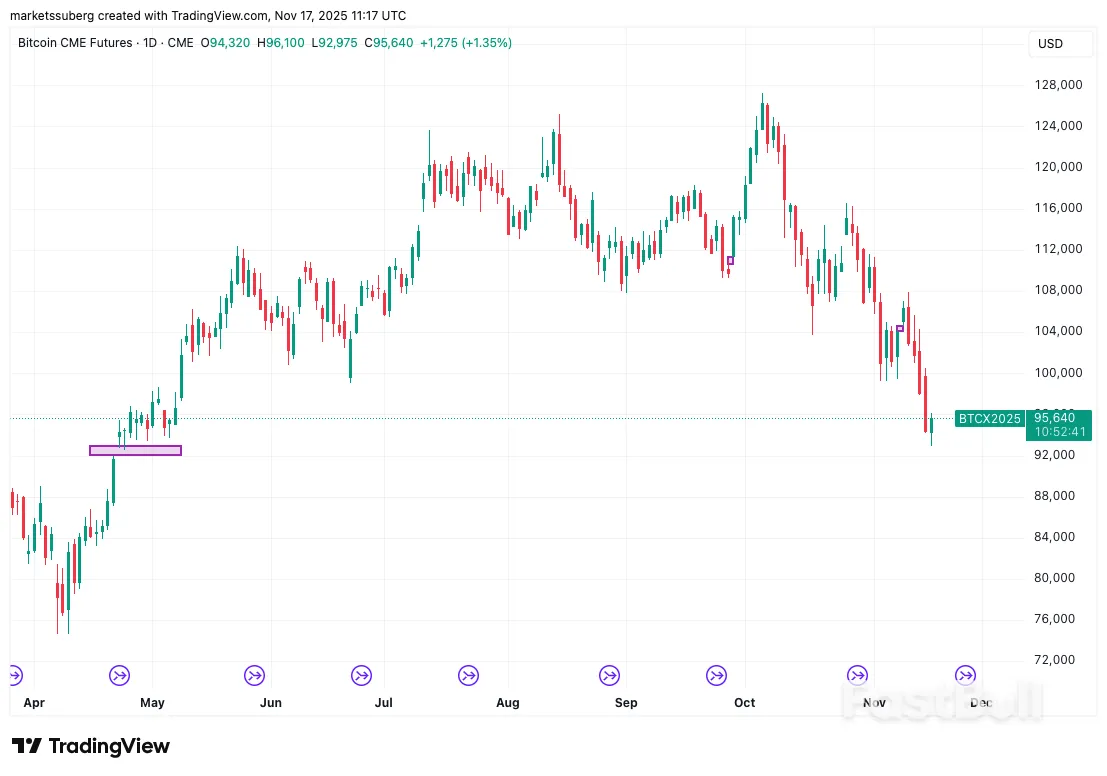
يتطلع السعر إلى "مغناطيس" رئيسي في شكل فجوة العقود الآجلة القديمة في بورصة CME والتي خلفتها فترة أبريل.
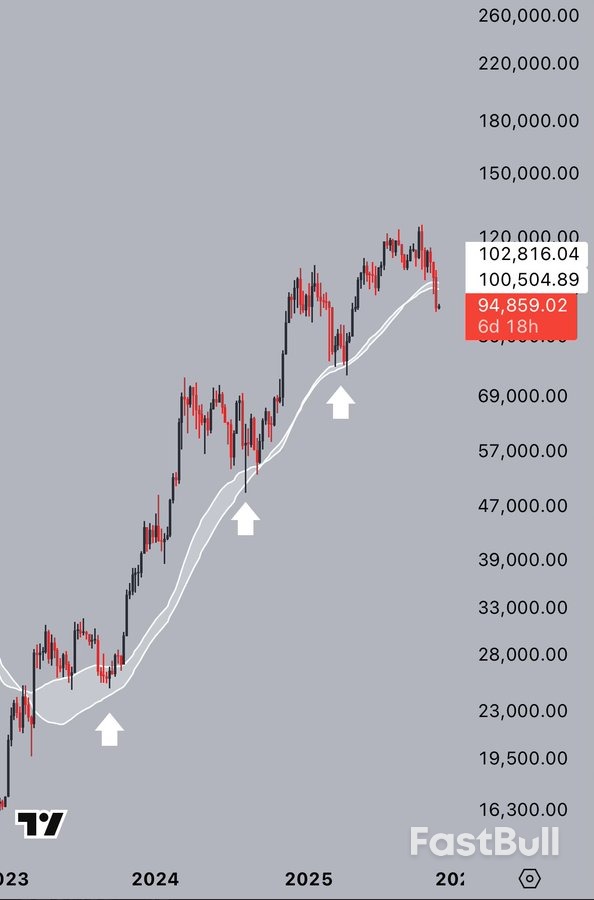
يؤدي فقدان خط الاتجاه الرئيسي إلى إجراء مقارنات مع أسواق الهبوط التاريخية، مع استعادة الدعم بعيدًا.
يبدو أن البيتكوين أصبح أشبه بـ "سهم التكنولوجيا ذات الرافعة المالية" مع اختفاء ارتباطه بالذهب.
تراجعت معنويات العملات المشفرة إلى أدنى مستوياتها في عام 2025، وسط "خوف شديد".
ارتفاعات سعر البيتكوين في عام 2025
تراجعت عملة البيتكوين إلى مستوى افتتاحها السنوي عند إغلاق الأسبوع يوم الأحد، حيث انخفضت إلى أقل من 93000 دولار، وفقًا لبيانات من Cointelegraph Markets Pro و TradingView.
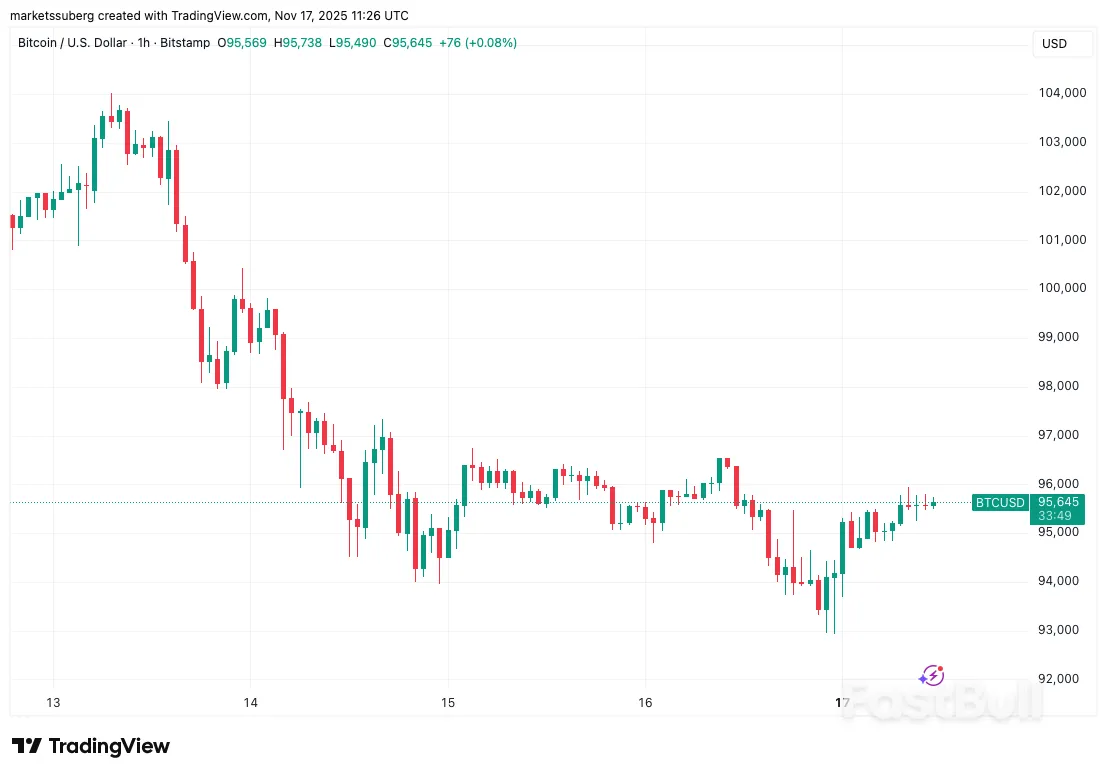
مخطط زوج بيتكوين/دولار أمريكي (BTC/USD) للساعة الواحدة. المصدر: كوينتيليغراف/ترادينغ فيو
كانت ردود أفعال المتداولين متباينة للغاية، حيث امتزجت التوقعات الهبوطية الواضحة مع آمال التعافي السريع للسوق.
حذر المتداول BitBull في أحدث تحليل له لسجل أوامر البورصة على X، من أن "حيتان Binance وضعت أوامر شراء كبيرة بين مستوى 88500 دولار إلى 92000 دولار".
أعلم أن الكثيرين يتوقعون وصول سعر البيتكوين إلى قاع محلي، لكن قد يتخطى سعره نطاق 88 ألف دولار إلى 90 ألف دولار. 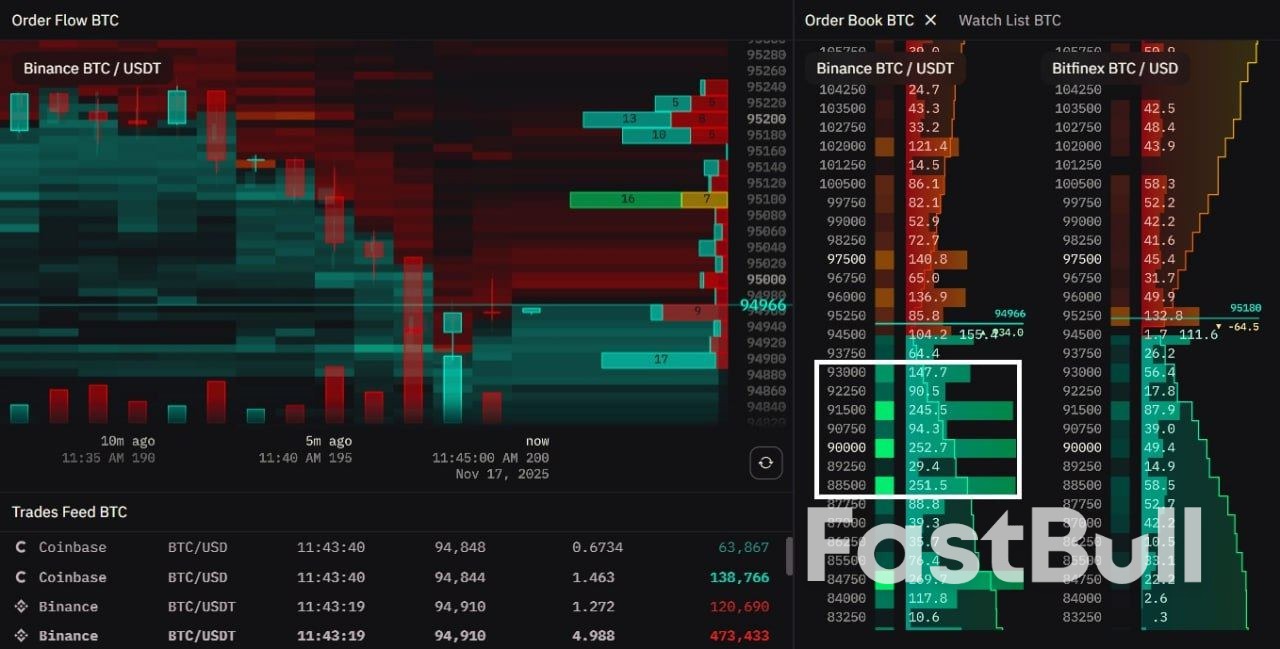 بيانات سجل طلبات شراء البيتكوين مقابل الدولار الأمريكي على منصة باينانس. المصدر: BitBull/X
أظهرت بيانات من مصدر المراقبة CoinGlass أن السعر ظل صامداً بفضل خط سيولة العطاءات طوال الليل، مع استعداد ظروف السيولة العامة لمحاولة الاختراق التالية.
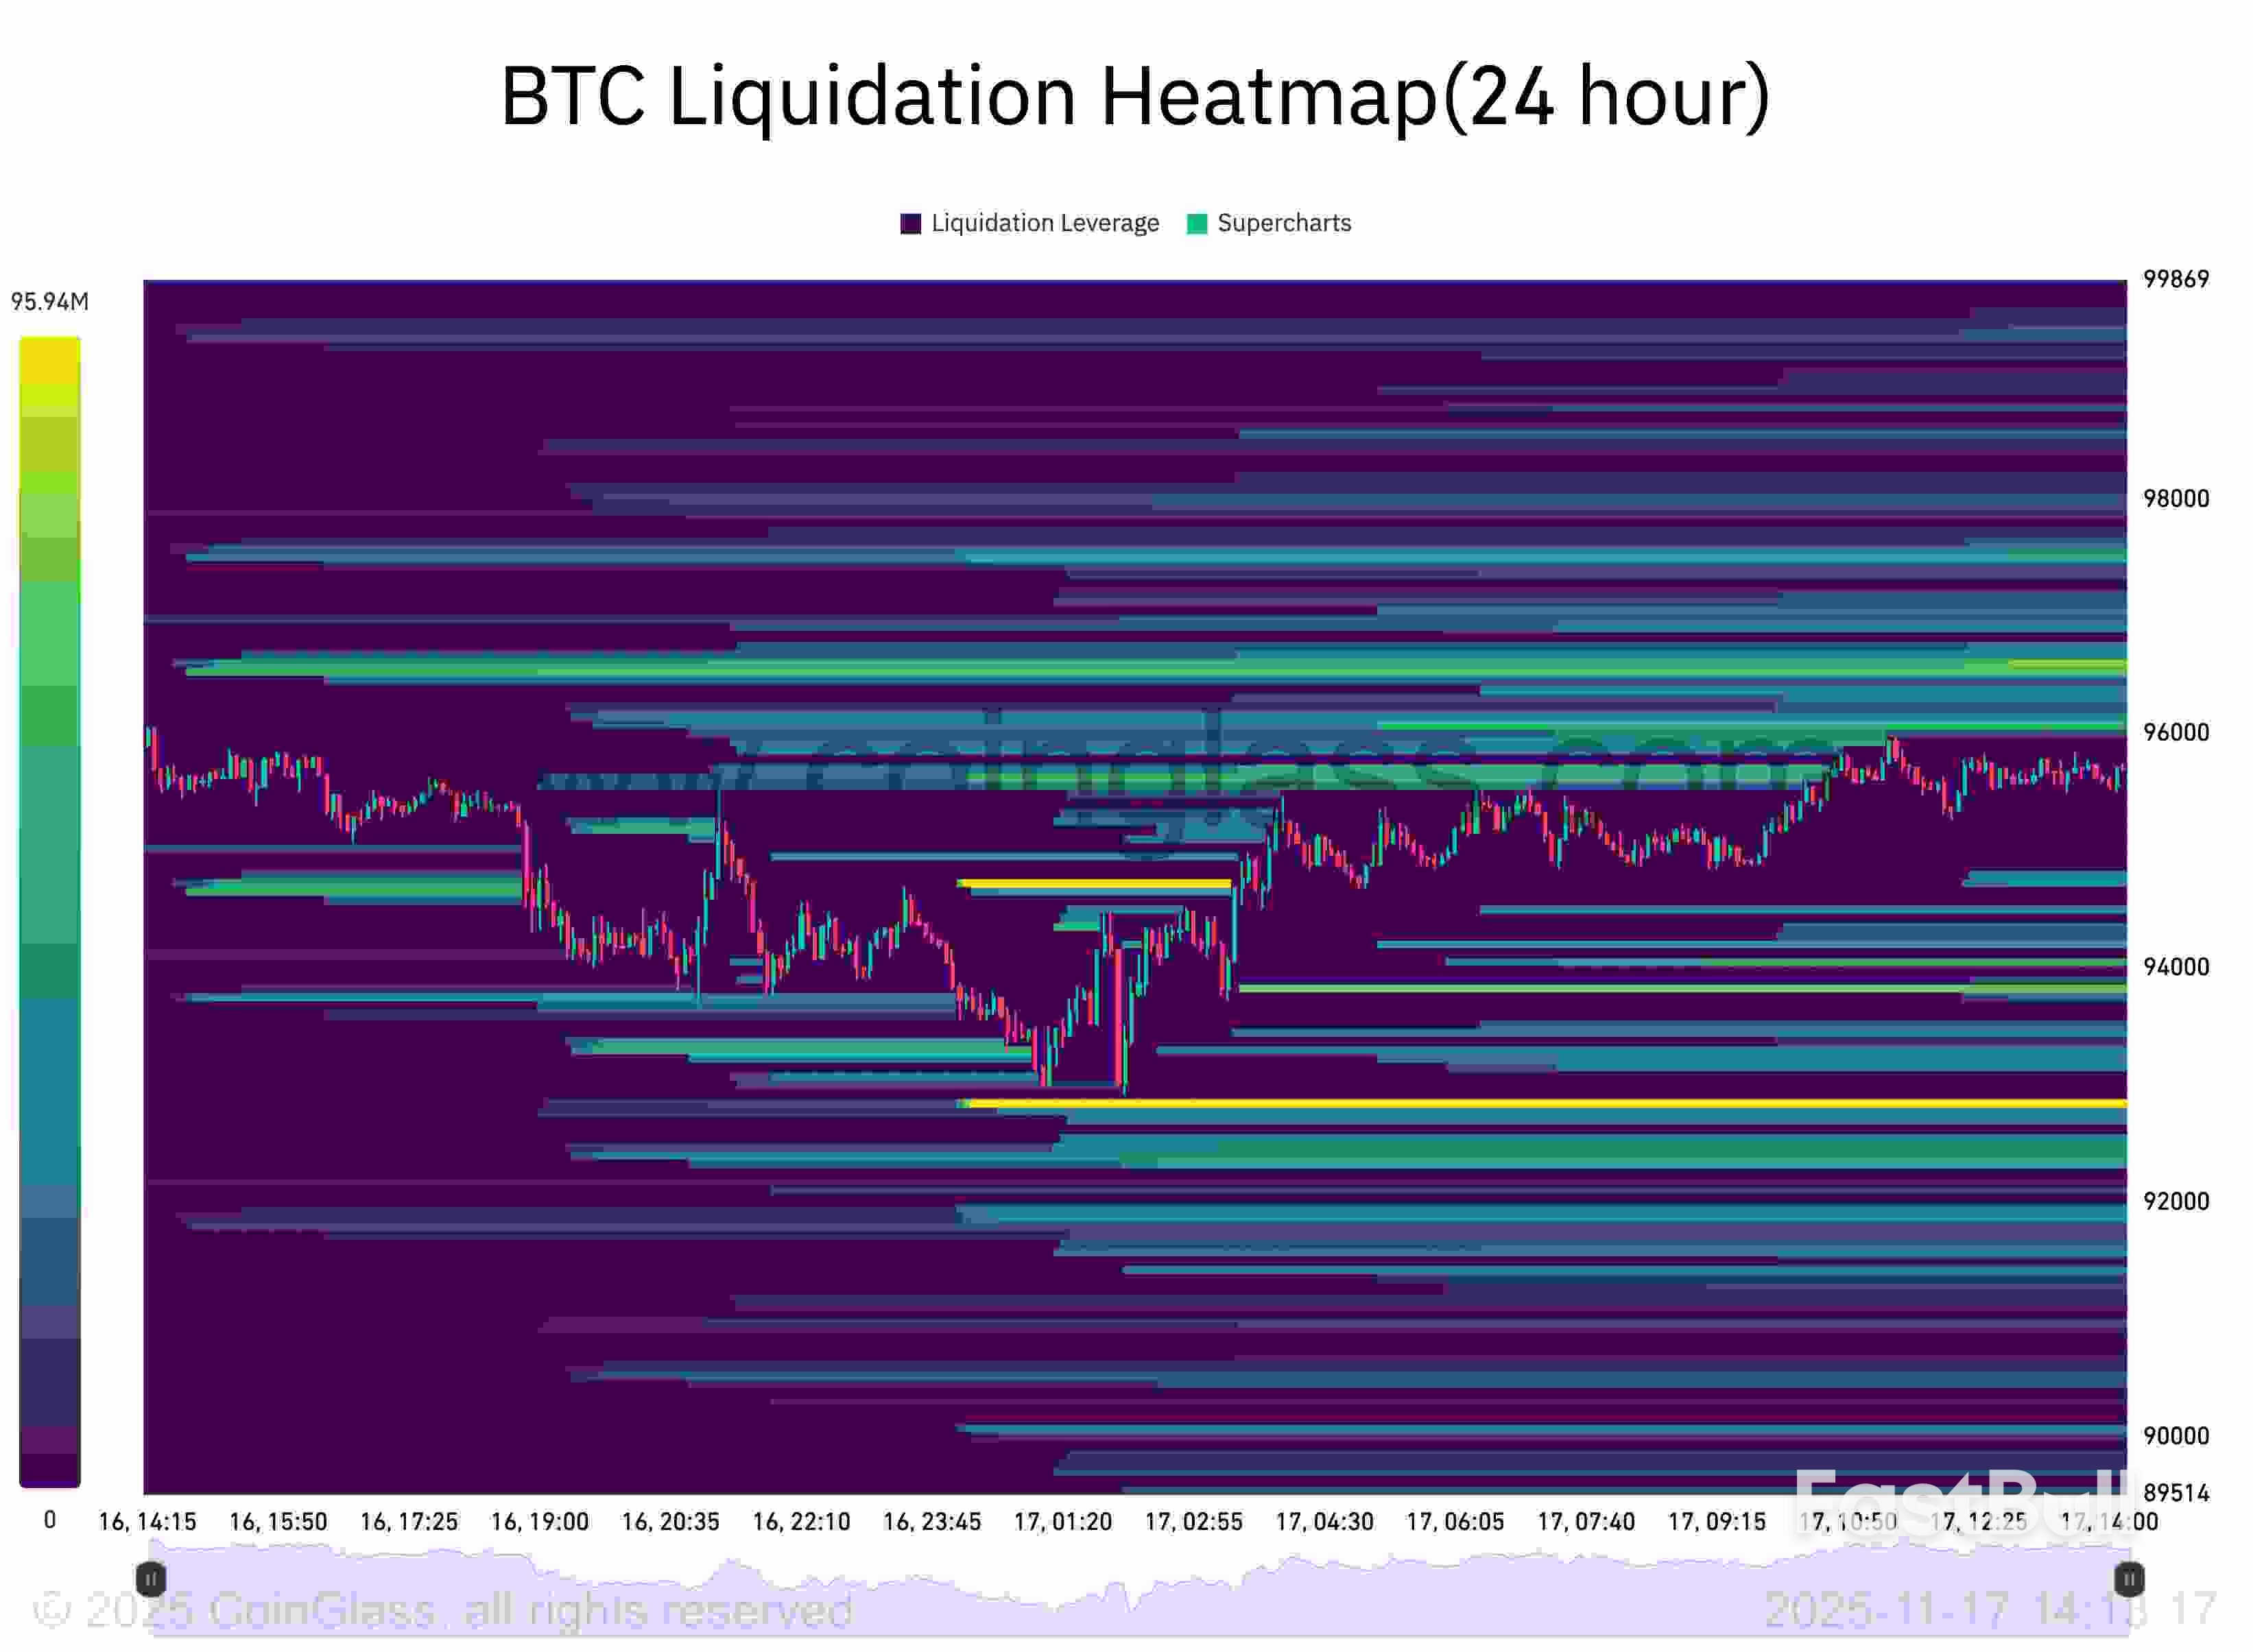
خريطة حرارية لتصفية بيتكوين. المصدر: كوين غلاس
وفي تعليقه، رأى متداول العملات المشفرة والمحلل ورجل الأعمال مايكل فان دي بوب أن السيولة تشكل عنصراً رئيسياً في تحركات الأسعار في المستقبل.
"من الناحية المثالية، أريد أن أرى تحركًا سريعًا للأعلى على $BTC هو ما أفضّل رؤيته"، هذا ما قاله لمتابعيه في ذلك اليوم.
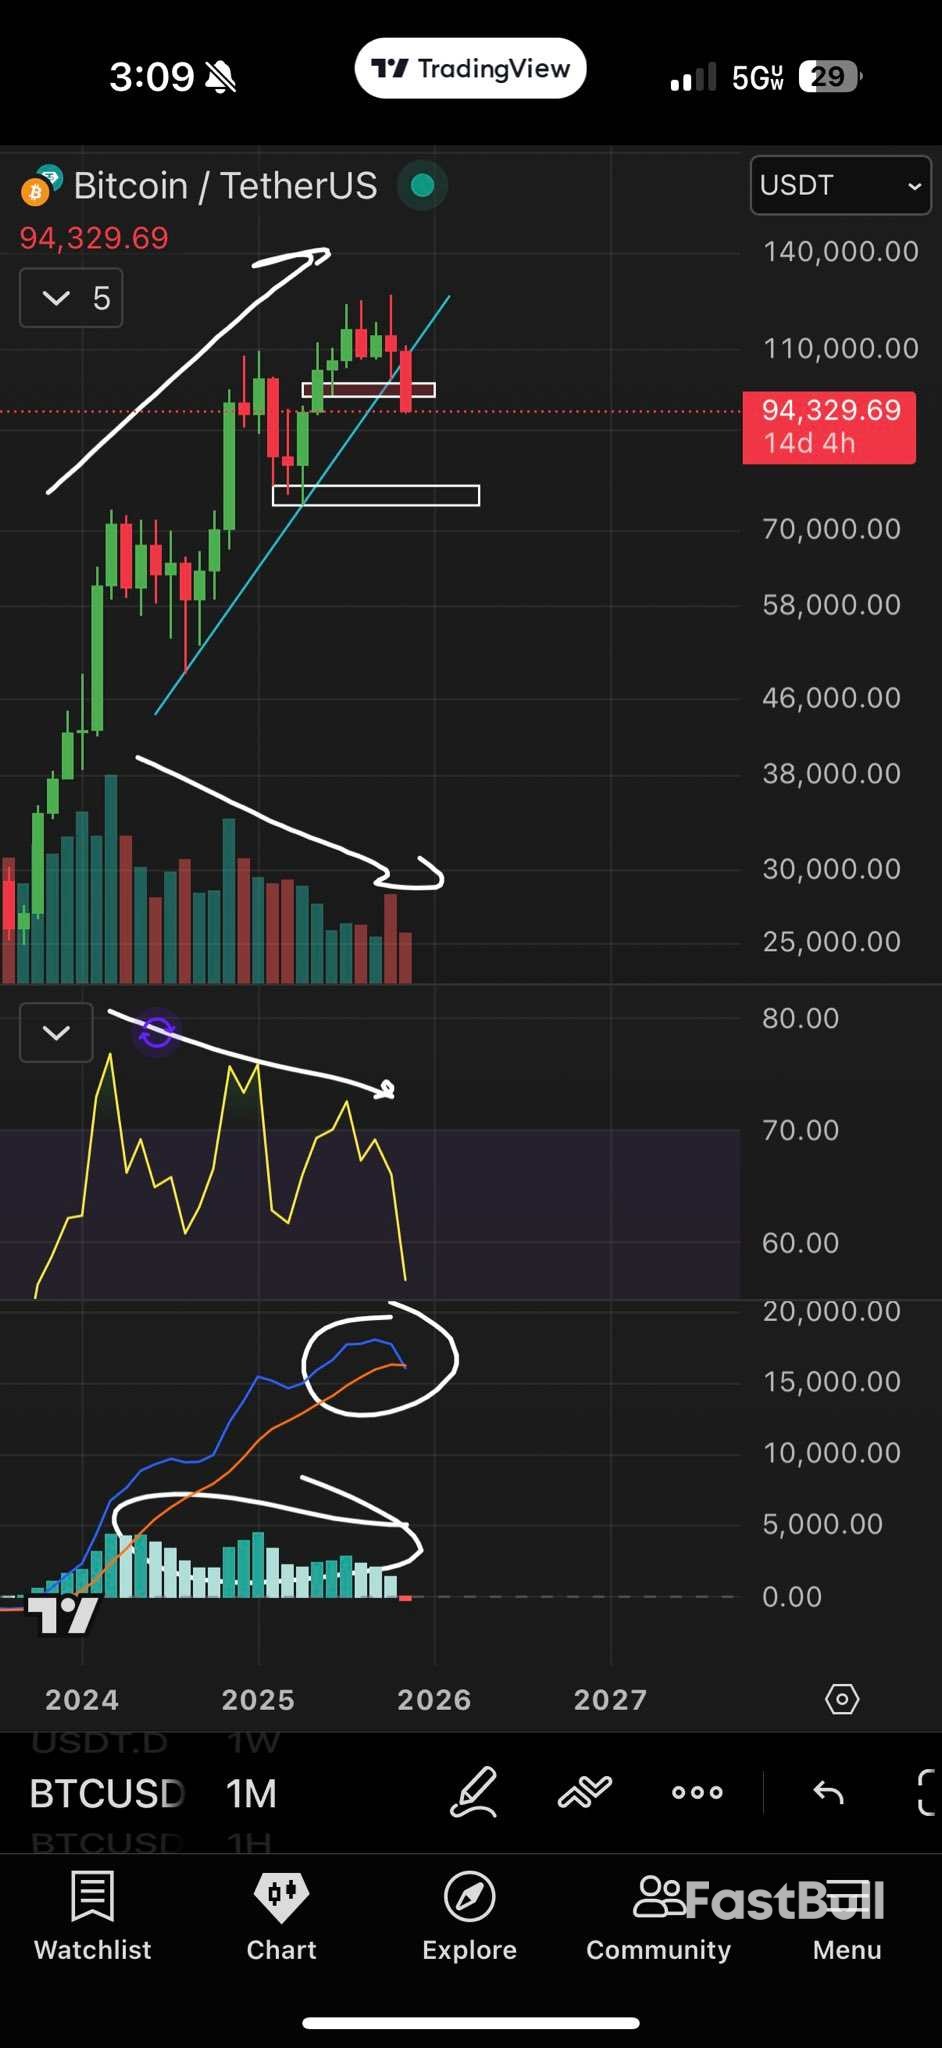
لقد تجاوزنا أدنى مستوى خلال عطلة نهاية الأسبوع، مما يعني أنني أتمنى أن نرى أدنى مستوى أعلى يتشكل هنا. إذا حدث ذلك، فستكون هناك تريليونات وتريليونات من السيولة القصيرة جاهزة للسحب. 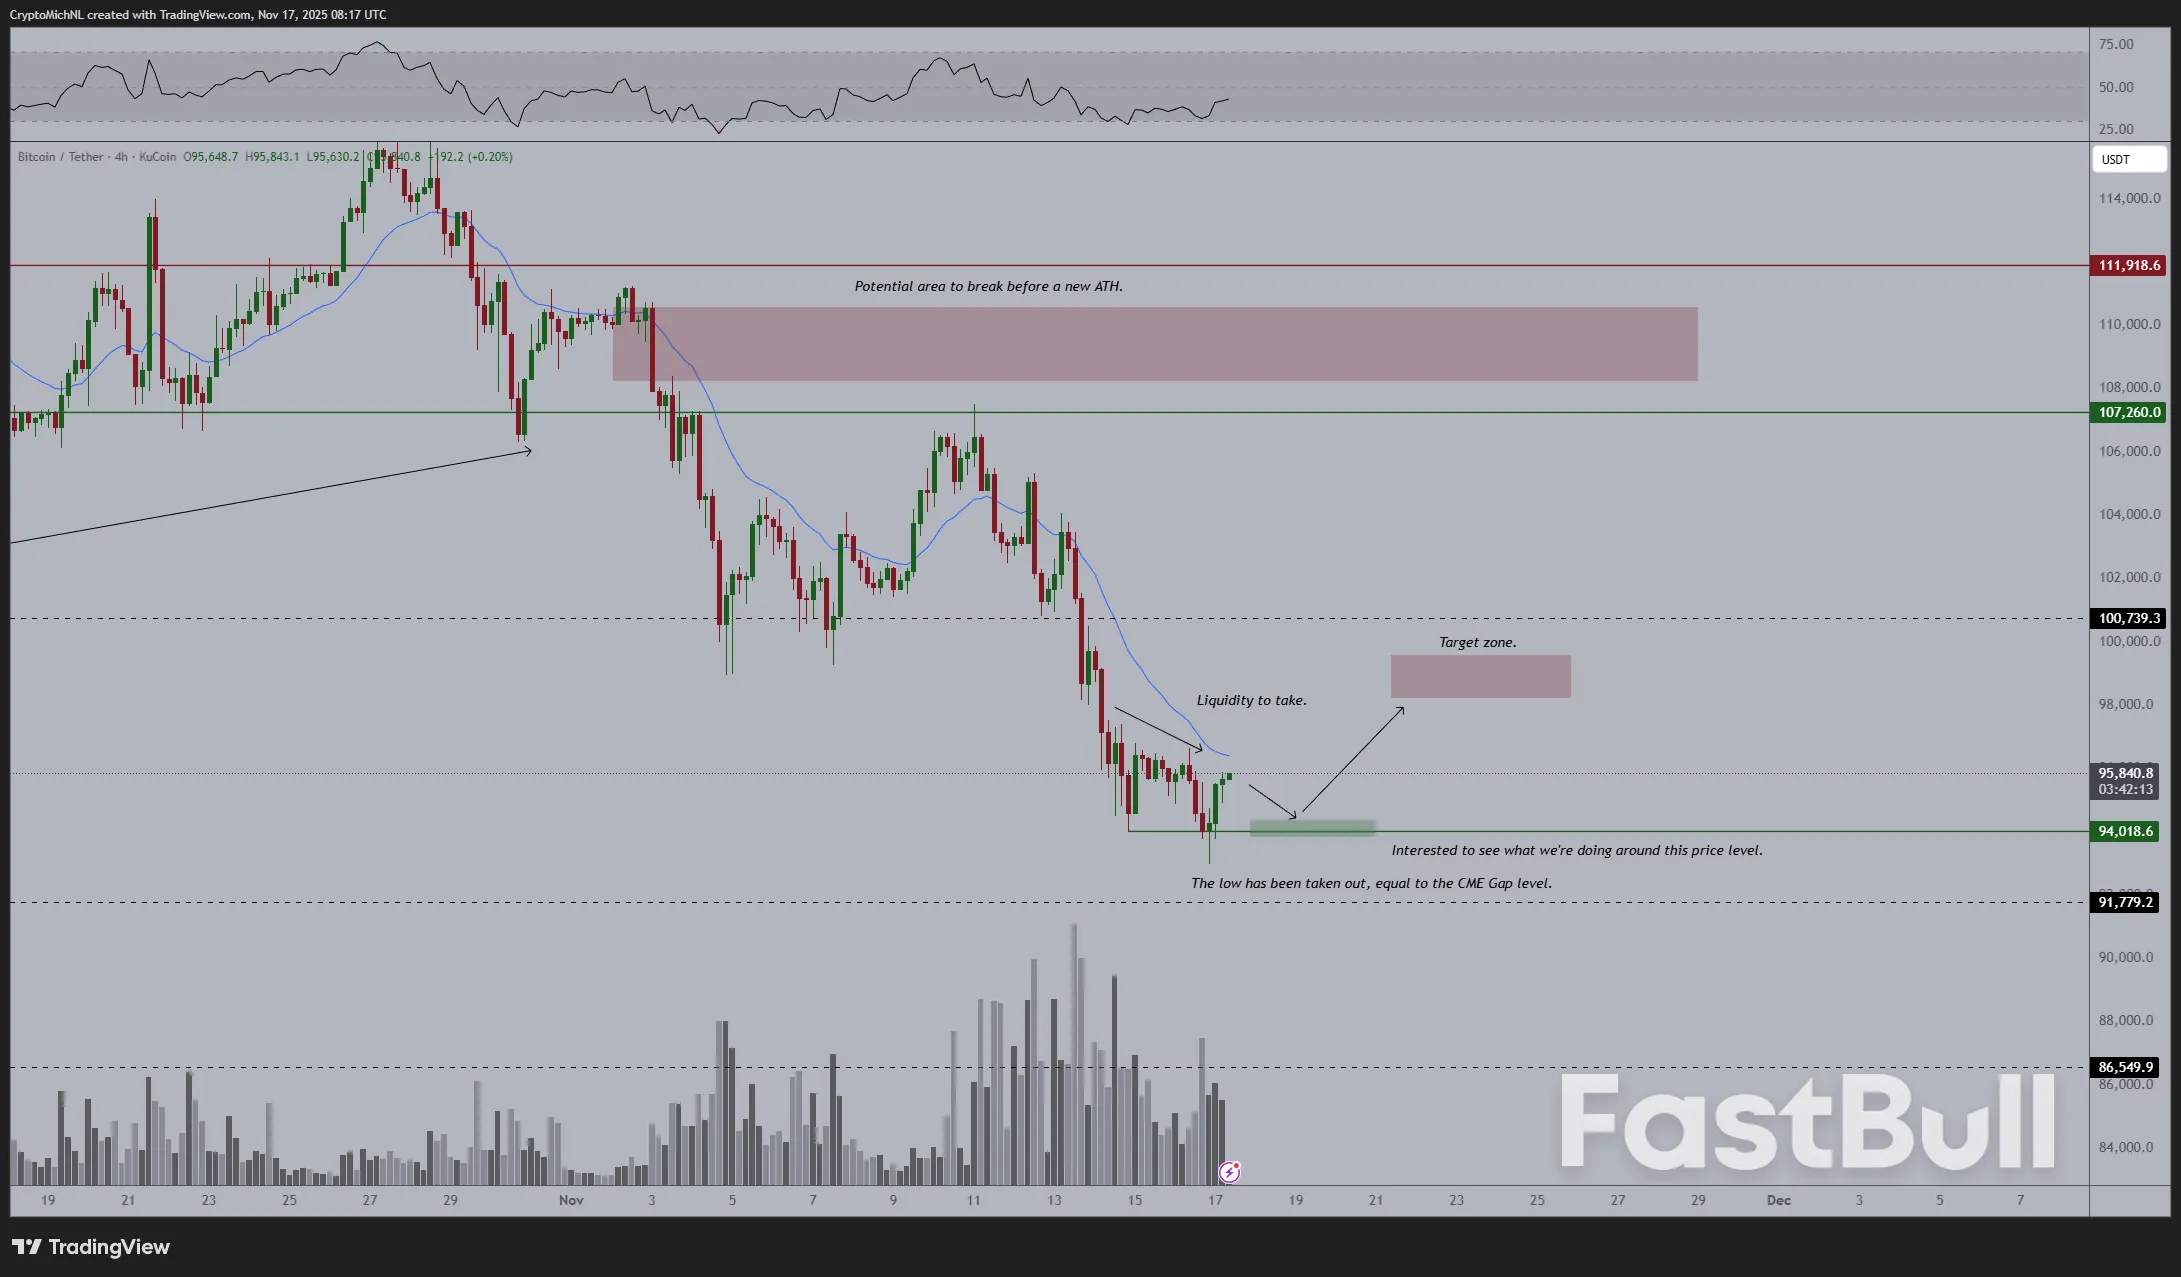 مخطط BTC/USDT لأربع ساعات. المصدر: مايكل فان دي بوب/X
استمرارًا للنبرة الأكثر تفاؤلاً، أعرب المتداول Crypto Tony عن إعجابه بالانتعاش الذي شهده زوج BTC/USD بعد أدنى المستويات المحلية.
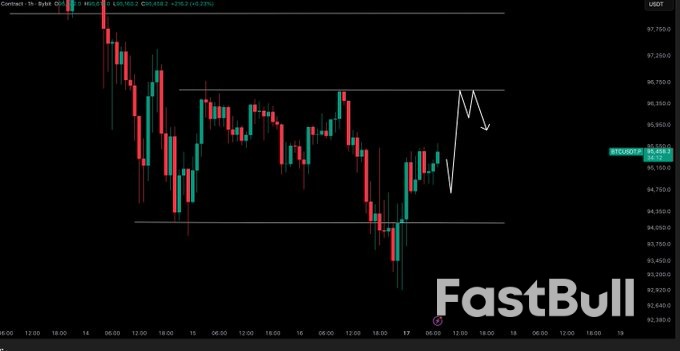
وأضاف تيد بيلوز، مستثمر العملات المشفرة ورجل الأعمال، أن "المستوى الرئيسي التالي الذي يجب على البيتكوين استرداده هو 98000 دولار، لأنه سيزيد من فرص الوصول إلى قاع محلي".
فجوة العقود الآجلة في بورصة CME أصبحت بعيدة المنال
أصبح هدف سعر BTC الرئيسي قصير الأجل للمشاركين في السوق الآن قريبًا بشكل مثير للدهشة.
تقع "الفجوة" في سوق العقود الآجلة للبيتكوين في مجموعة CME، والتي نشأت في الأصل في شهر أبريل، أسفل المستويات المحلية المنخفضة الحالية.
من حوالي 91,800 دولار إلى 92,700 دولار، كانت الفجوة على الرادار منذ أن بدأ زوج BTC/USD في التراجع عن أعلى مستوياته التاريخية الحالية في منتصف أكتوبر.
أدى الإغلاق الأسبوعي إلى اقتراب سعر البيتكوين من الإغلاق، ولكن في وقت كتابة هذا التقرير، لا يزال السعر شاغرًا.
قال المتداول هاردي لمتابعي X في منشور حول هذا الموضوع: "هناك فجوة واضحة في CME عند 91.9 ألف دولار - 92.5 ألف دولار وأنت تعرف بالفعل كيف تعمل هذه اللعبة".
“Whales want their orders filled before the next leg. Expect the dip, embrace the volatility and get ready for the bounce once that gap is taken. Textbook move loading.”
CME Group Bitcoin futures one-day chart with gap. Source: Cointelegraph/TradingView
Hardy referred to the market’s habit of “filling” futures gaps, which form over weekends and have historically acted as short-term magnets for price. The April gap is something of an anomaly, remaining untouched for over half a year.
“The 92k region also coincides with an unfilled CME gap, increasing the odds of a short-term technical bounce if tested,” trading resource QCP Capital continued in its latest “Asia Color” market update on the day.
“Yet, as seen over the past few weeks, dense overhead supply could limit the strength of any rebound.”
Major trend line breakdown fuels bear-market woes
The CME gap, however, is far from the only key level concerning traders this week.
In a rare divergence, BTC/USD has now given up its 50-week simple moving average (SMA) as support.
The latest weekly candle close left price far below the 50-week SMA, which currently sits at around $102,850.
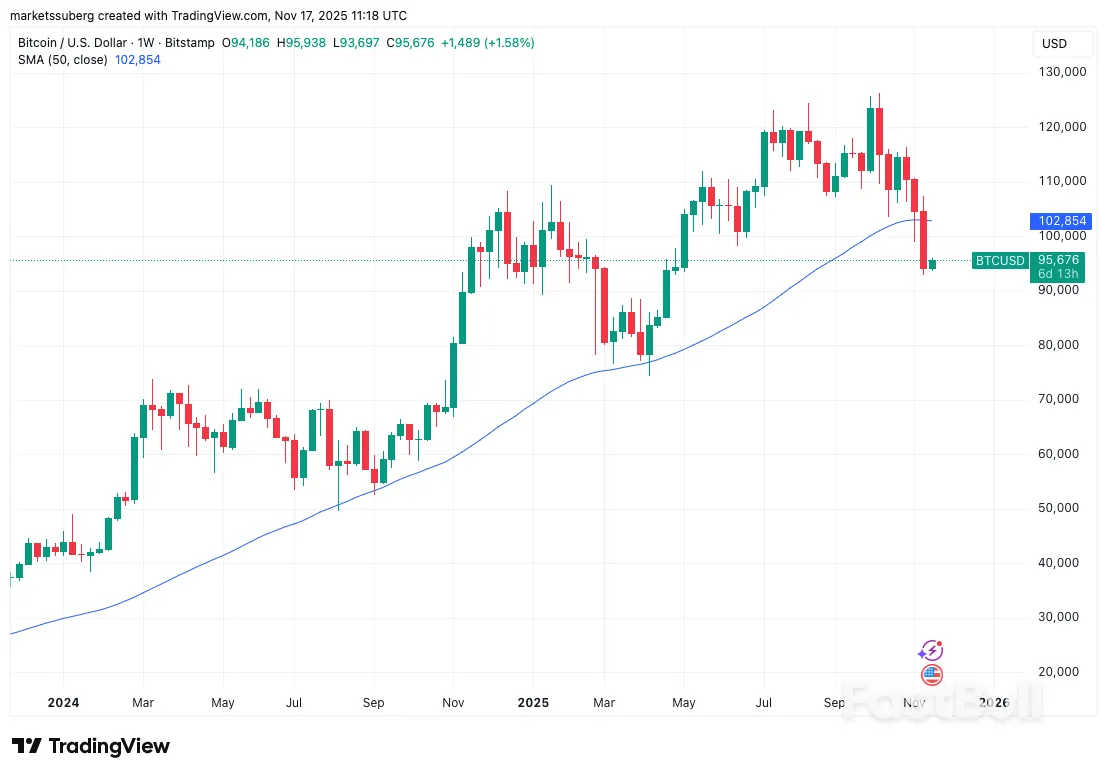
BTC/USD one-week chart with 50SMA. Source: Cointelegraph/TradingView
The phenomenon did not go unnoticed, with X trading account The Swing Trader stressing the unusual nature of the price’s treatment of what is normally a solid support line.
“And this is very important because Bitcoin has never lost the 50-week MA and still been in a bull cycle,” it said in video analysis.
BTC price has only lost the 50-week trend line four times in its history, reinforcing the move as one typically associated with bear markets. No weekly candles have closed below it since March 2023.
“Every single cycle, the 50-week MA holds for four years and then we finally lose it,” The Swing Trader continued, describing Bitcoin as “technically breaking down.”
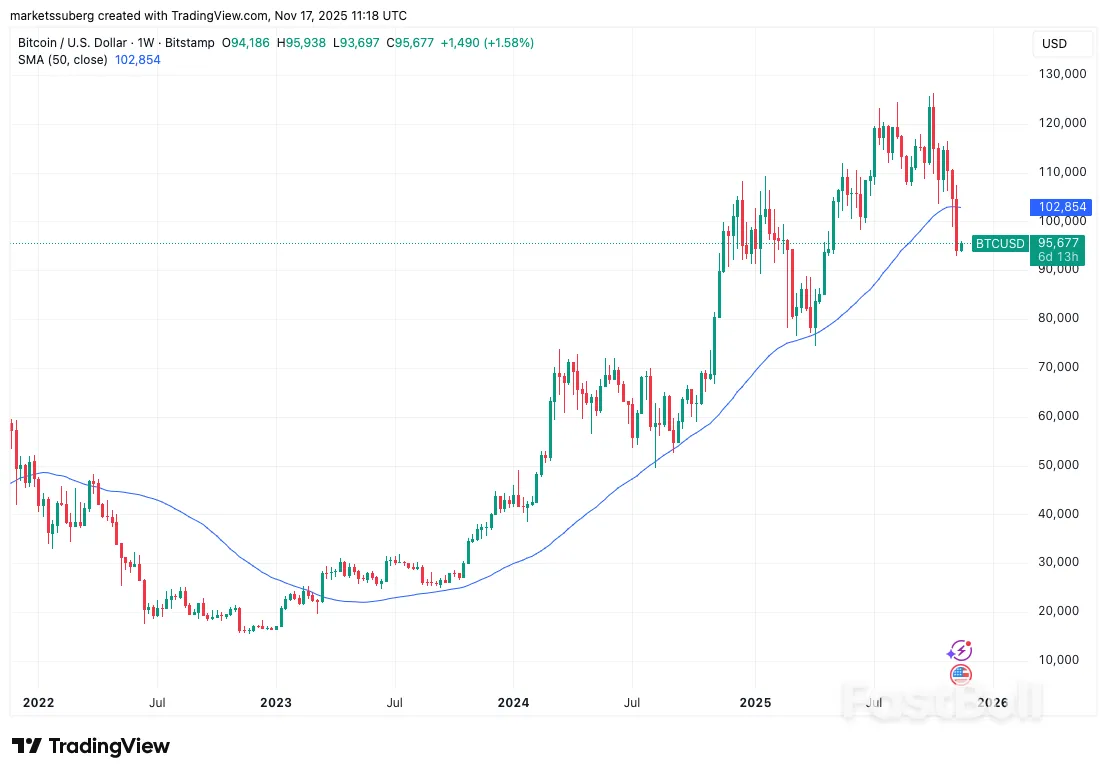
BTC/USD one-week chart with 50SMA. Source: Cointelegraph/TradingView
QCP added that the loss of the trend line “reinforces a medium-term bearish bias,” but added that a bearish trend reversal hinged on even lower supports at $88,000 and $74,500.
“For now, crypto’s bull cycle hangs in the balance. A short-term bounce may come, but the path of least resistance remains lower,” it concluded.
Taking the exponential (EMA) equivalent of the 50-week SMA into account, the situation is arguably even worse.
As noted by trader Jelle, the “cloud” formed by the 50-week SMA and EMA has not failed as support since BTC/USD traded at $22,000.
“Trend officially lost,” he summarized.
Crypto diverges from risk-asset trend
On macro, commentary turned to crypto’s unusual behavior compared to the broader risk-asset environment.
Amid talk of Japan enacting giant economic stimulus as part of an overall worldwide liquidity boost, stocks futures were “completely unfazed” by the weekend crypto drop, trading resource The Kobeissi Letter noted.
“Even as crypto has lost -$100 billion since Friday, US stock market futures are GREEN. Meanwhile, gold just opened above $4,100/oz and yields are on the rise,” it wrote in an X post.
The latest action continues a status quo already in place — crypto, unlike stocks, failed to celebrate the reopening of the US government last week.
Kobeissi’s data showed the paradoxical impact of what should be good news on crypto market performance throughout October and November.
“The isolated nature of the -25% crypto downturn further supports our view: This is a leverage and liquidation-based crypto ‘bear market,’ it continued, describing Bitcoin as trading like a "leveraged tech stock.”
“A bottom forms when market structure is re-established.”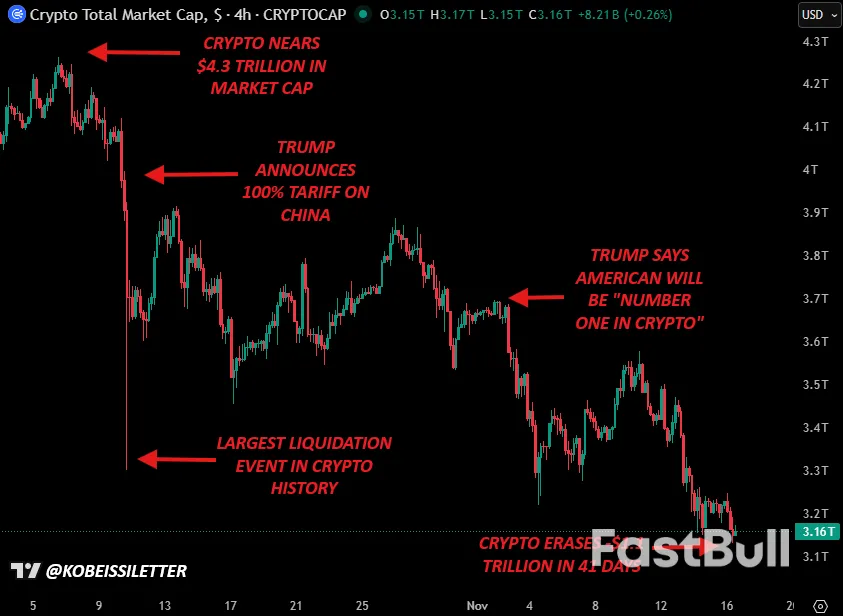 Crypto total market cap four-hour chart. Source: The Kobeissi Letter/X
With the correlation between Bitcoin and gold “essentially zero,” analysis of large-cap tech stocks instead holds the key to understanding crypto volatility.
“Bitcoin’s correlation to US technology stocks has rarely been higher: The 30-day correlation between Bitcoin and the Nasdaq 100 Index hit ~0.80, the highest since 2022,” Kobeissi observed.
“This is also the 2nd-highest reading over the last 10 years. Correlation has remained positive over the last 5 years, except for brief periods in 2023.”
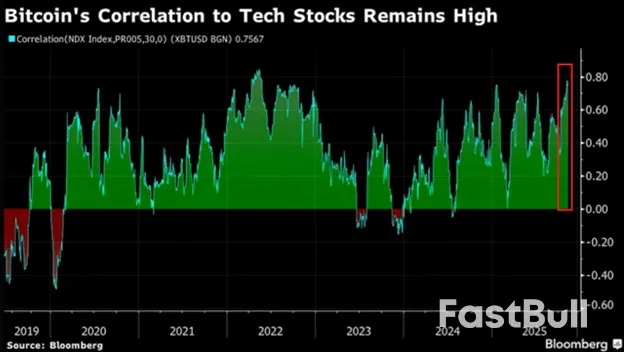 Bitcoin vs. Nasdaq correlation. Source: The Kobeissi Letter/X
The week’s macroeconomic data releases, meanwhile, focus on employment data — readings conspicuously absent throughout the US government shutdown.
In part thanks to this lack of data, CME Group’s FedWatch Tool shows that markets are now unconvinced that the Federal Reserve will cut interest rates by 0.25% at its next meeting on Dec. 10.
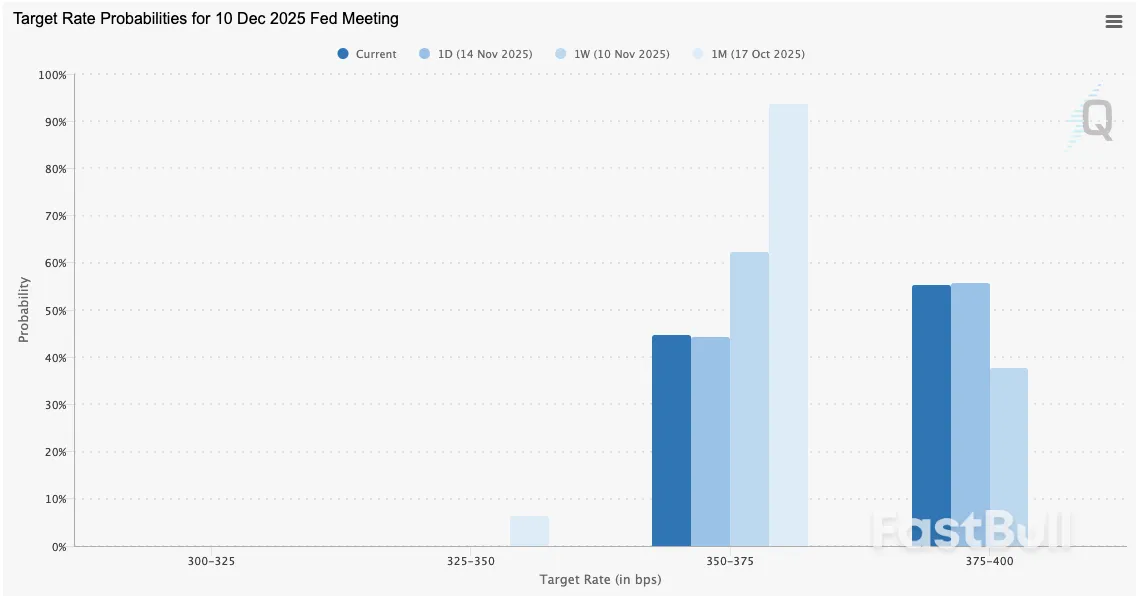
Fed target rate probability comparison for Dec. 10 FOMC meeting (screenshot). Source: CME Group
Extreme fear in the driving seat
In a sign of just how little the average trader believes in a crypto market comeback, sentiment toward both Bitcoin and altcoins has collapsed.
The latest figures from the Crypto Fear Greed Index confirms that the mood is now lower than at any point since late February.
Then, as now, the Index set a 2025 low of just 10/100 — deep within its “extreme fear” bracket. By contrast, just six weeks ago, it measured 74/100, on the cusp of “extreme greed.”
Commenting, trader Daan Crypto Trades likened the atmosphere to the implosion of crypto exchange FTX in 2022, toward the end of the last crypto bear market.
“This metric is in no way actionable. It can sit at greed for months while markets keep rallying, just as it can sit at the fear levels for a prolonged period of time,” he acknowledged on X.
“But it is still interesting to see how quickly things can change around from greed to fear and the other way around. Especially in crypto, things can turn really fast as we all know.”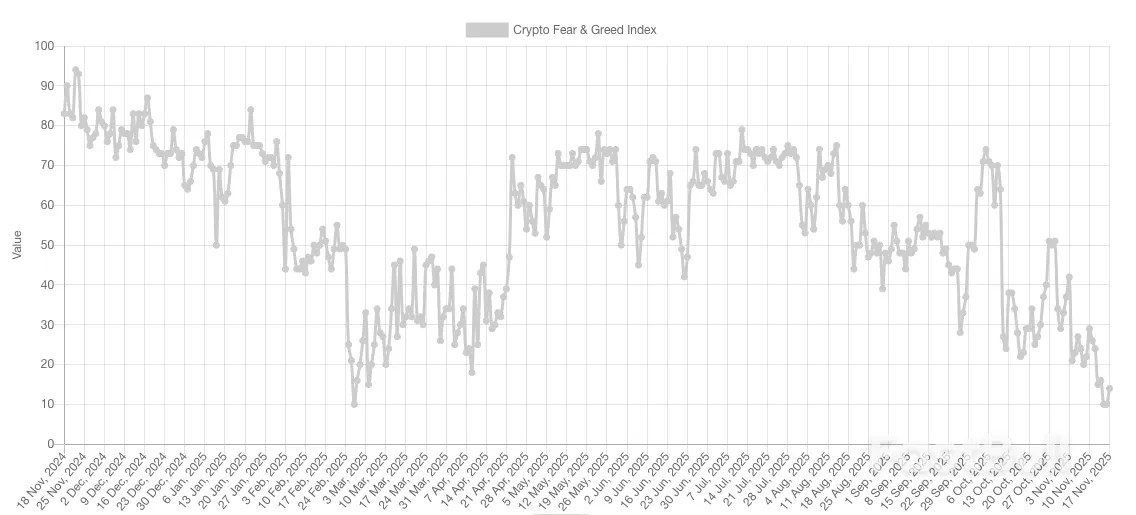 Crypto Fear Greed Index (screenshot). Source: Alternative.me
في الأسبوع الماضي، أفاد موقع كوينتيليغراف أن معنويات الجماهير يمكن أن توفر رؤى حول انعكاسات سوق العملات المشفرة.
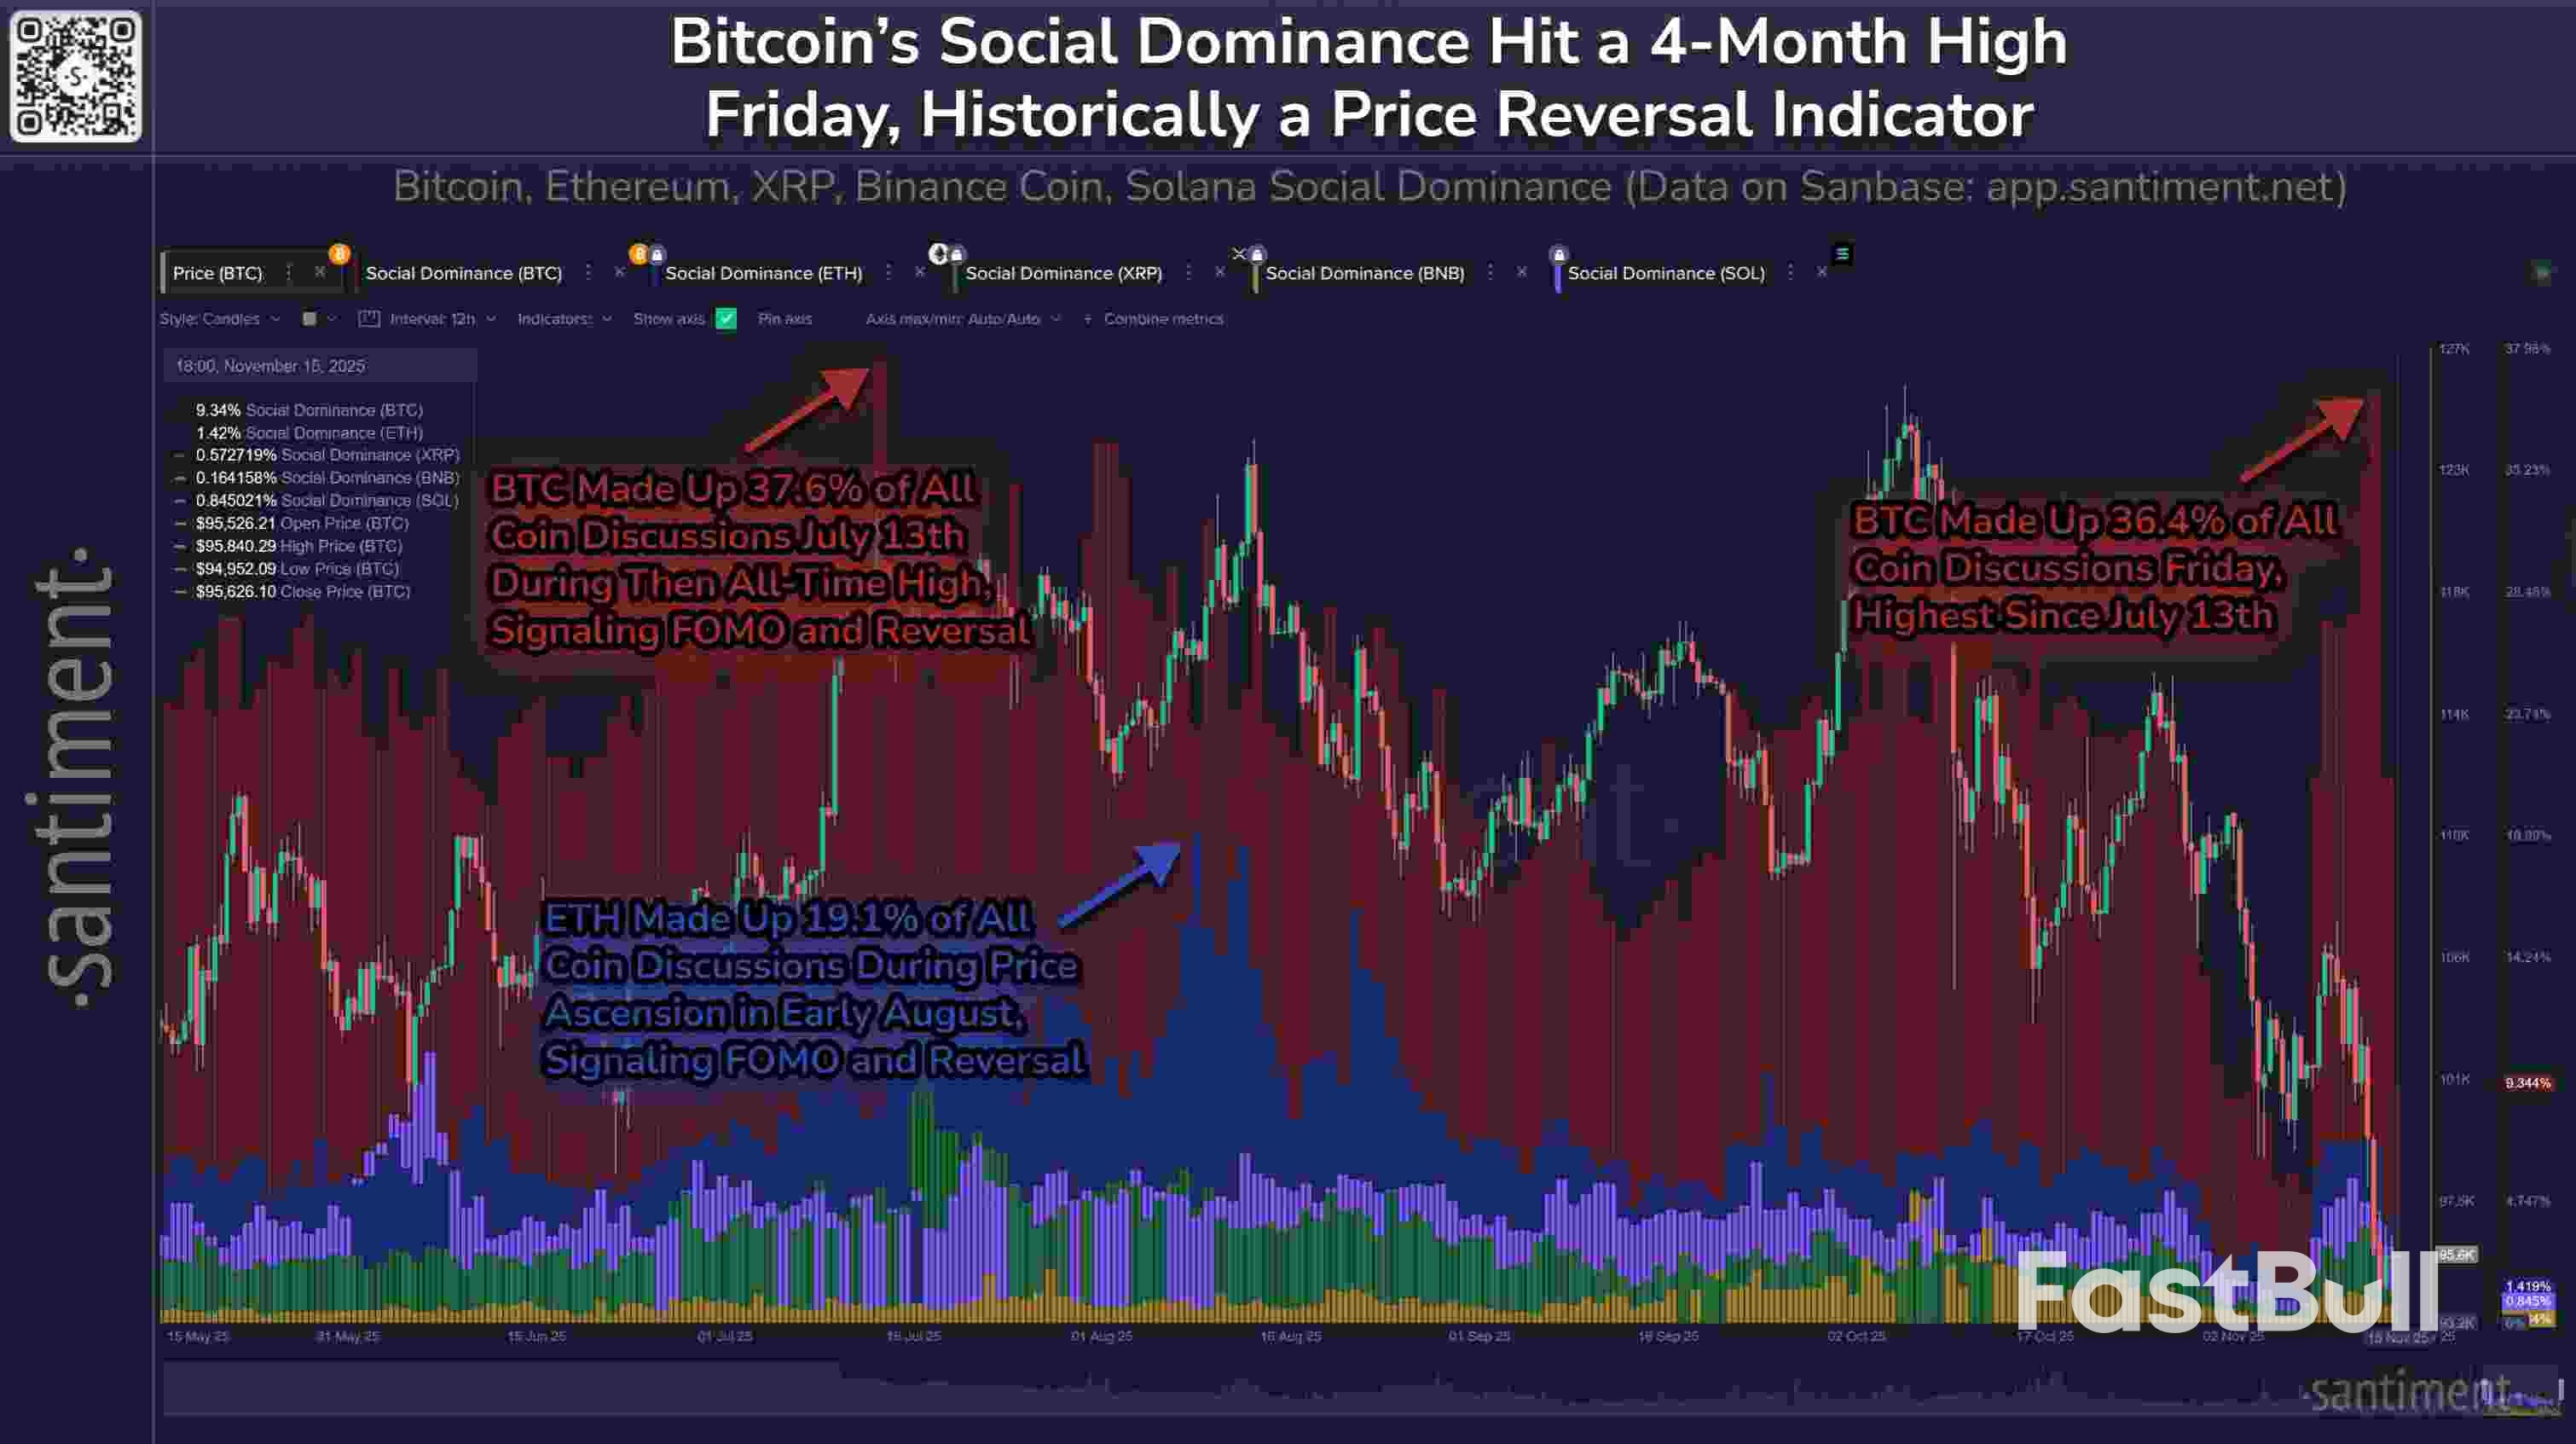
والآن، تتطلع منصة الأبحاث Santiment إلى عودة الاهتمام بعملة البيتكوين باعتبارها إشارة صعود محتملة في طور التكوين.
"على الرغم من عدم وجود إشارة مضمونة لقاع العملة المشفرة، فإن احتمالات انعكاس السوق تزداد بشكل كبير عندما ترتفع الهيمنة الاجتماعية للبيتكوين"، كما كتب في X Sunday إلى جانب بيانات الملكية.
"خلال انخفاض يوم الجمعة إلى ما دون 95 ألف دولار، وصلت أسعار المناقشة إلى أعلى مستوى لها في أربعة أشهر، مما يشير إلى حالة من الذعر الشديد بين قطاع التجزئة.
بيانات هيمنة البيتكوين على وسائل التواصل الاجتماعي المصدر: Santiment/X
المصدر: كوينتيليغراف


 بيانات سجل طلبات شراء البيتكوين مقابل الدولار الأمريكي على منصة باينانس. المصدر: BitBull/X
 مخطط BTC/USDT لأربع ساعات. المصدر: مايكل فان دي بوب/X


 Crypto total market cap four-hour chart. Source: The Kobeissi Letter/X
 Bitcoin vs. Nasdaq correlation. Source: The Kobeissi Letter/X
 Crypto Fear Greed Index (screenshot). Source: Alternative.me